A story opens on the lay of the land, a map with the subject at the centre and 3 to 6 entrances. The suggested route then runs through 5 to 8 beats: the hook, the reality check, the crowd, the hedge, the hidden cast, the missing chapter, another ending and your story. Each beat is one claim of at most 90 characters, at most three numbers beside their comparisons, and a picture with one callout. Use ← → to move, ↑ for the map and Esc to step out. The evidence sidebar holds the sources, "Show the working" and how firm the beat is.
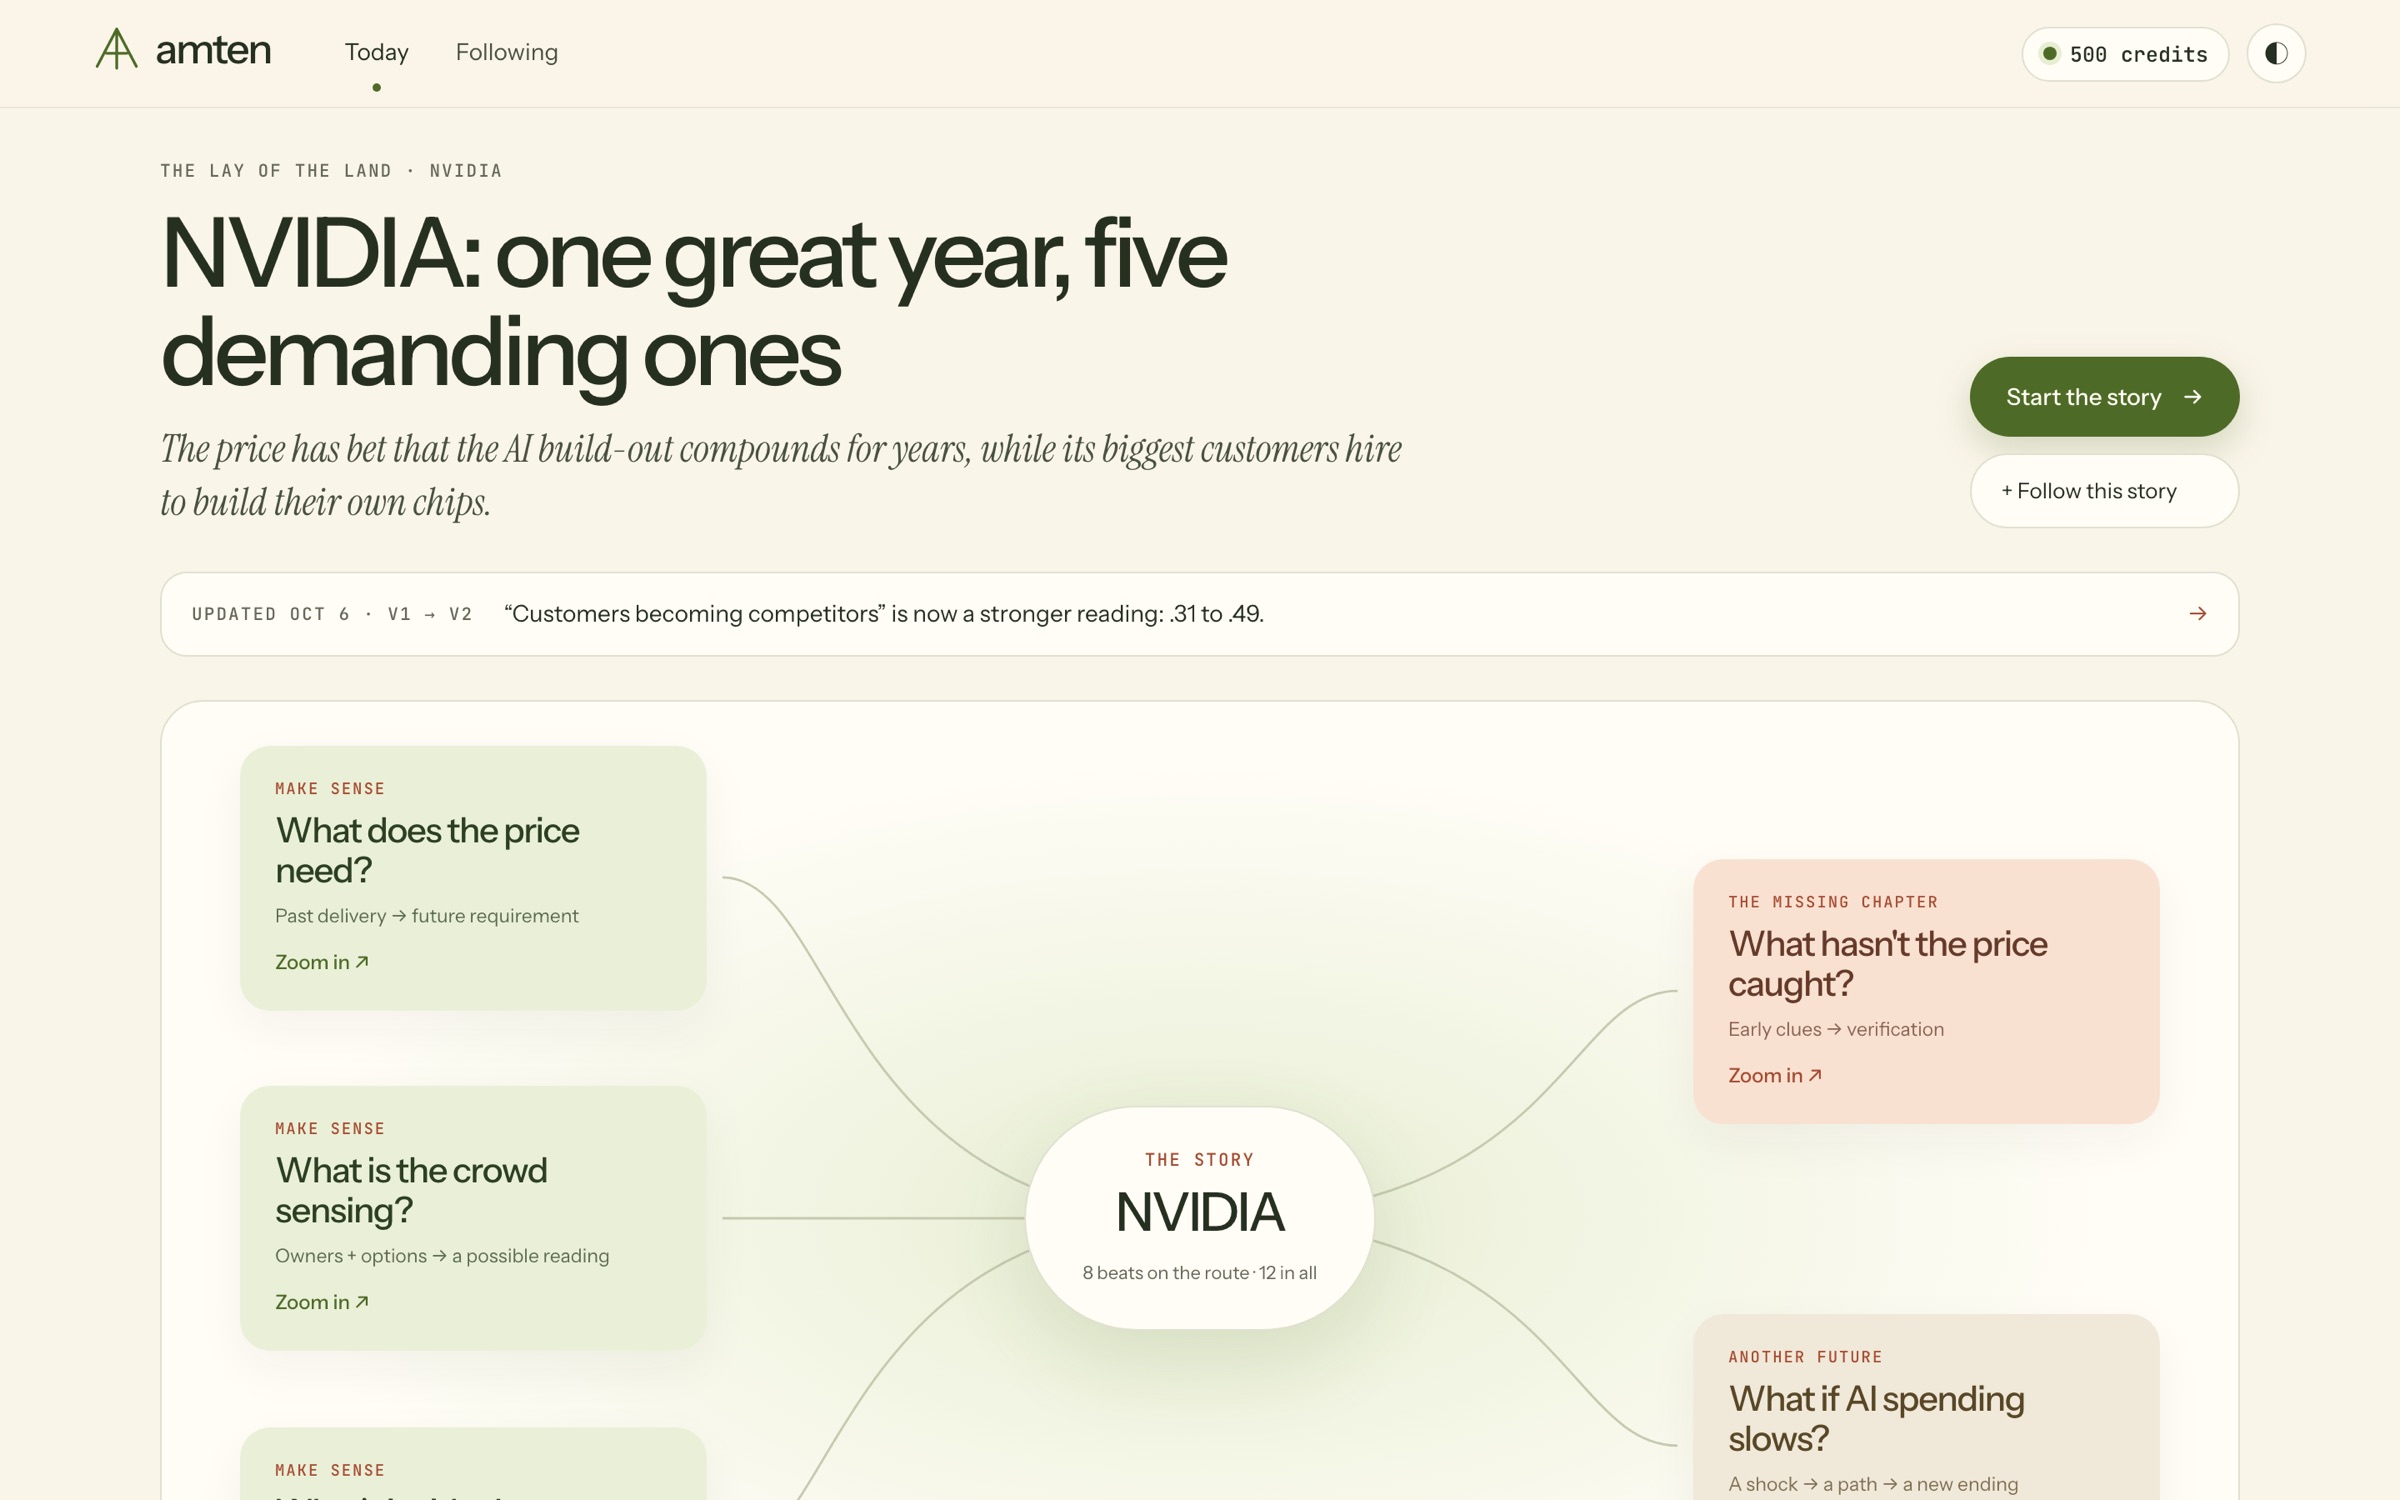
The lay of the land
The map is the story's table of contents drawn as a place. The subject sits in the middle. Make-sense entrances (olive) sit to the left, missing-chapter entrances (coral) to the right, another-future entrances (wheat) below. Each entrance names its question, such as "What does the price need?" or "What if AI spending slows?", and says how many beats it leads to.
Branches that you or other readers have grown appear as new entrances, so the map gets richer as the story is questioned. A line across the top reports the latest version's change, for example "Updated Oct 6 · v1 → v2".
Anatomy of a beat
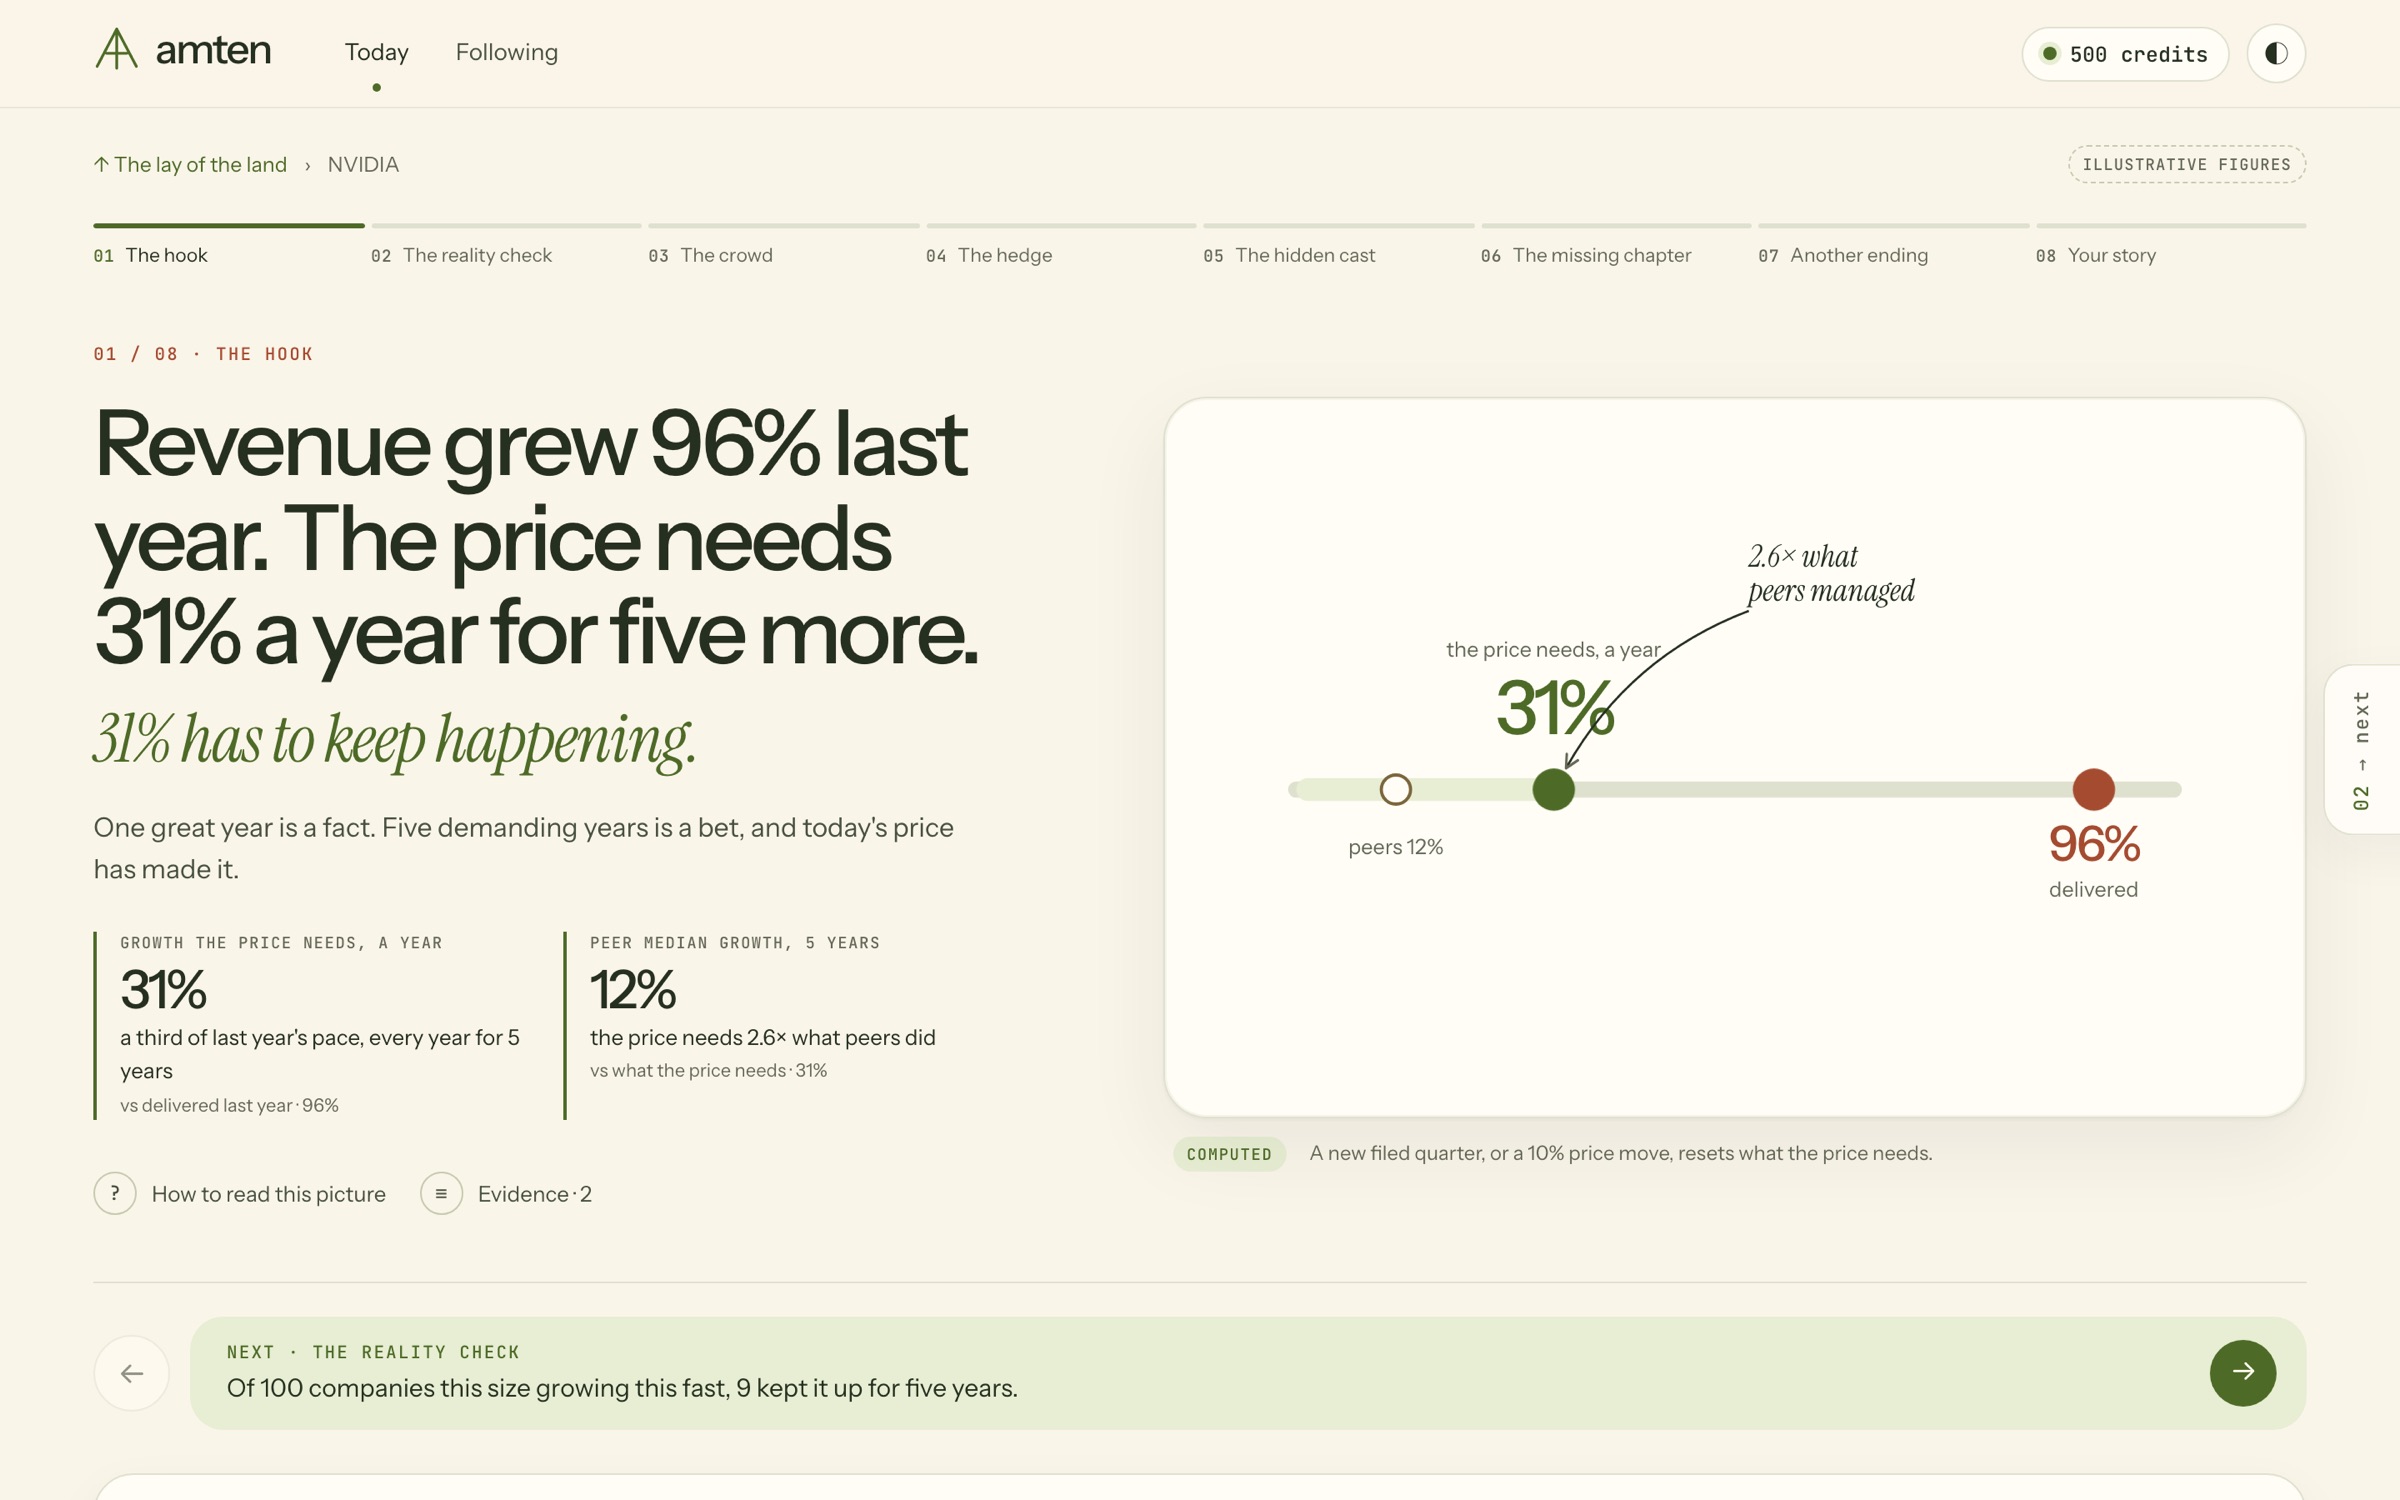
A beat is built to be understood in 5 to 10 seconds. The parts are fixed, so the eye learns where to look after two or three beats.
| Part | Rule | The illustrative NVIDIA hook |
|---|---|---|
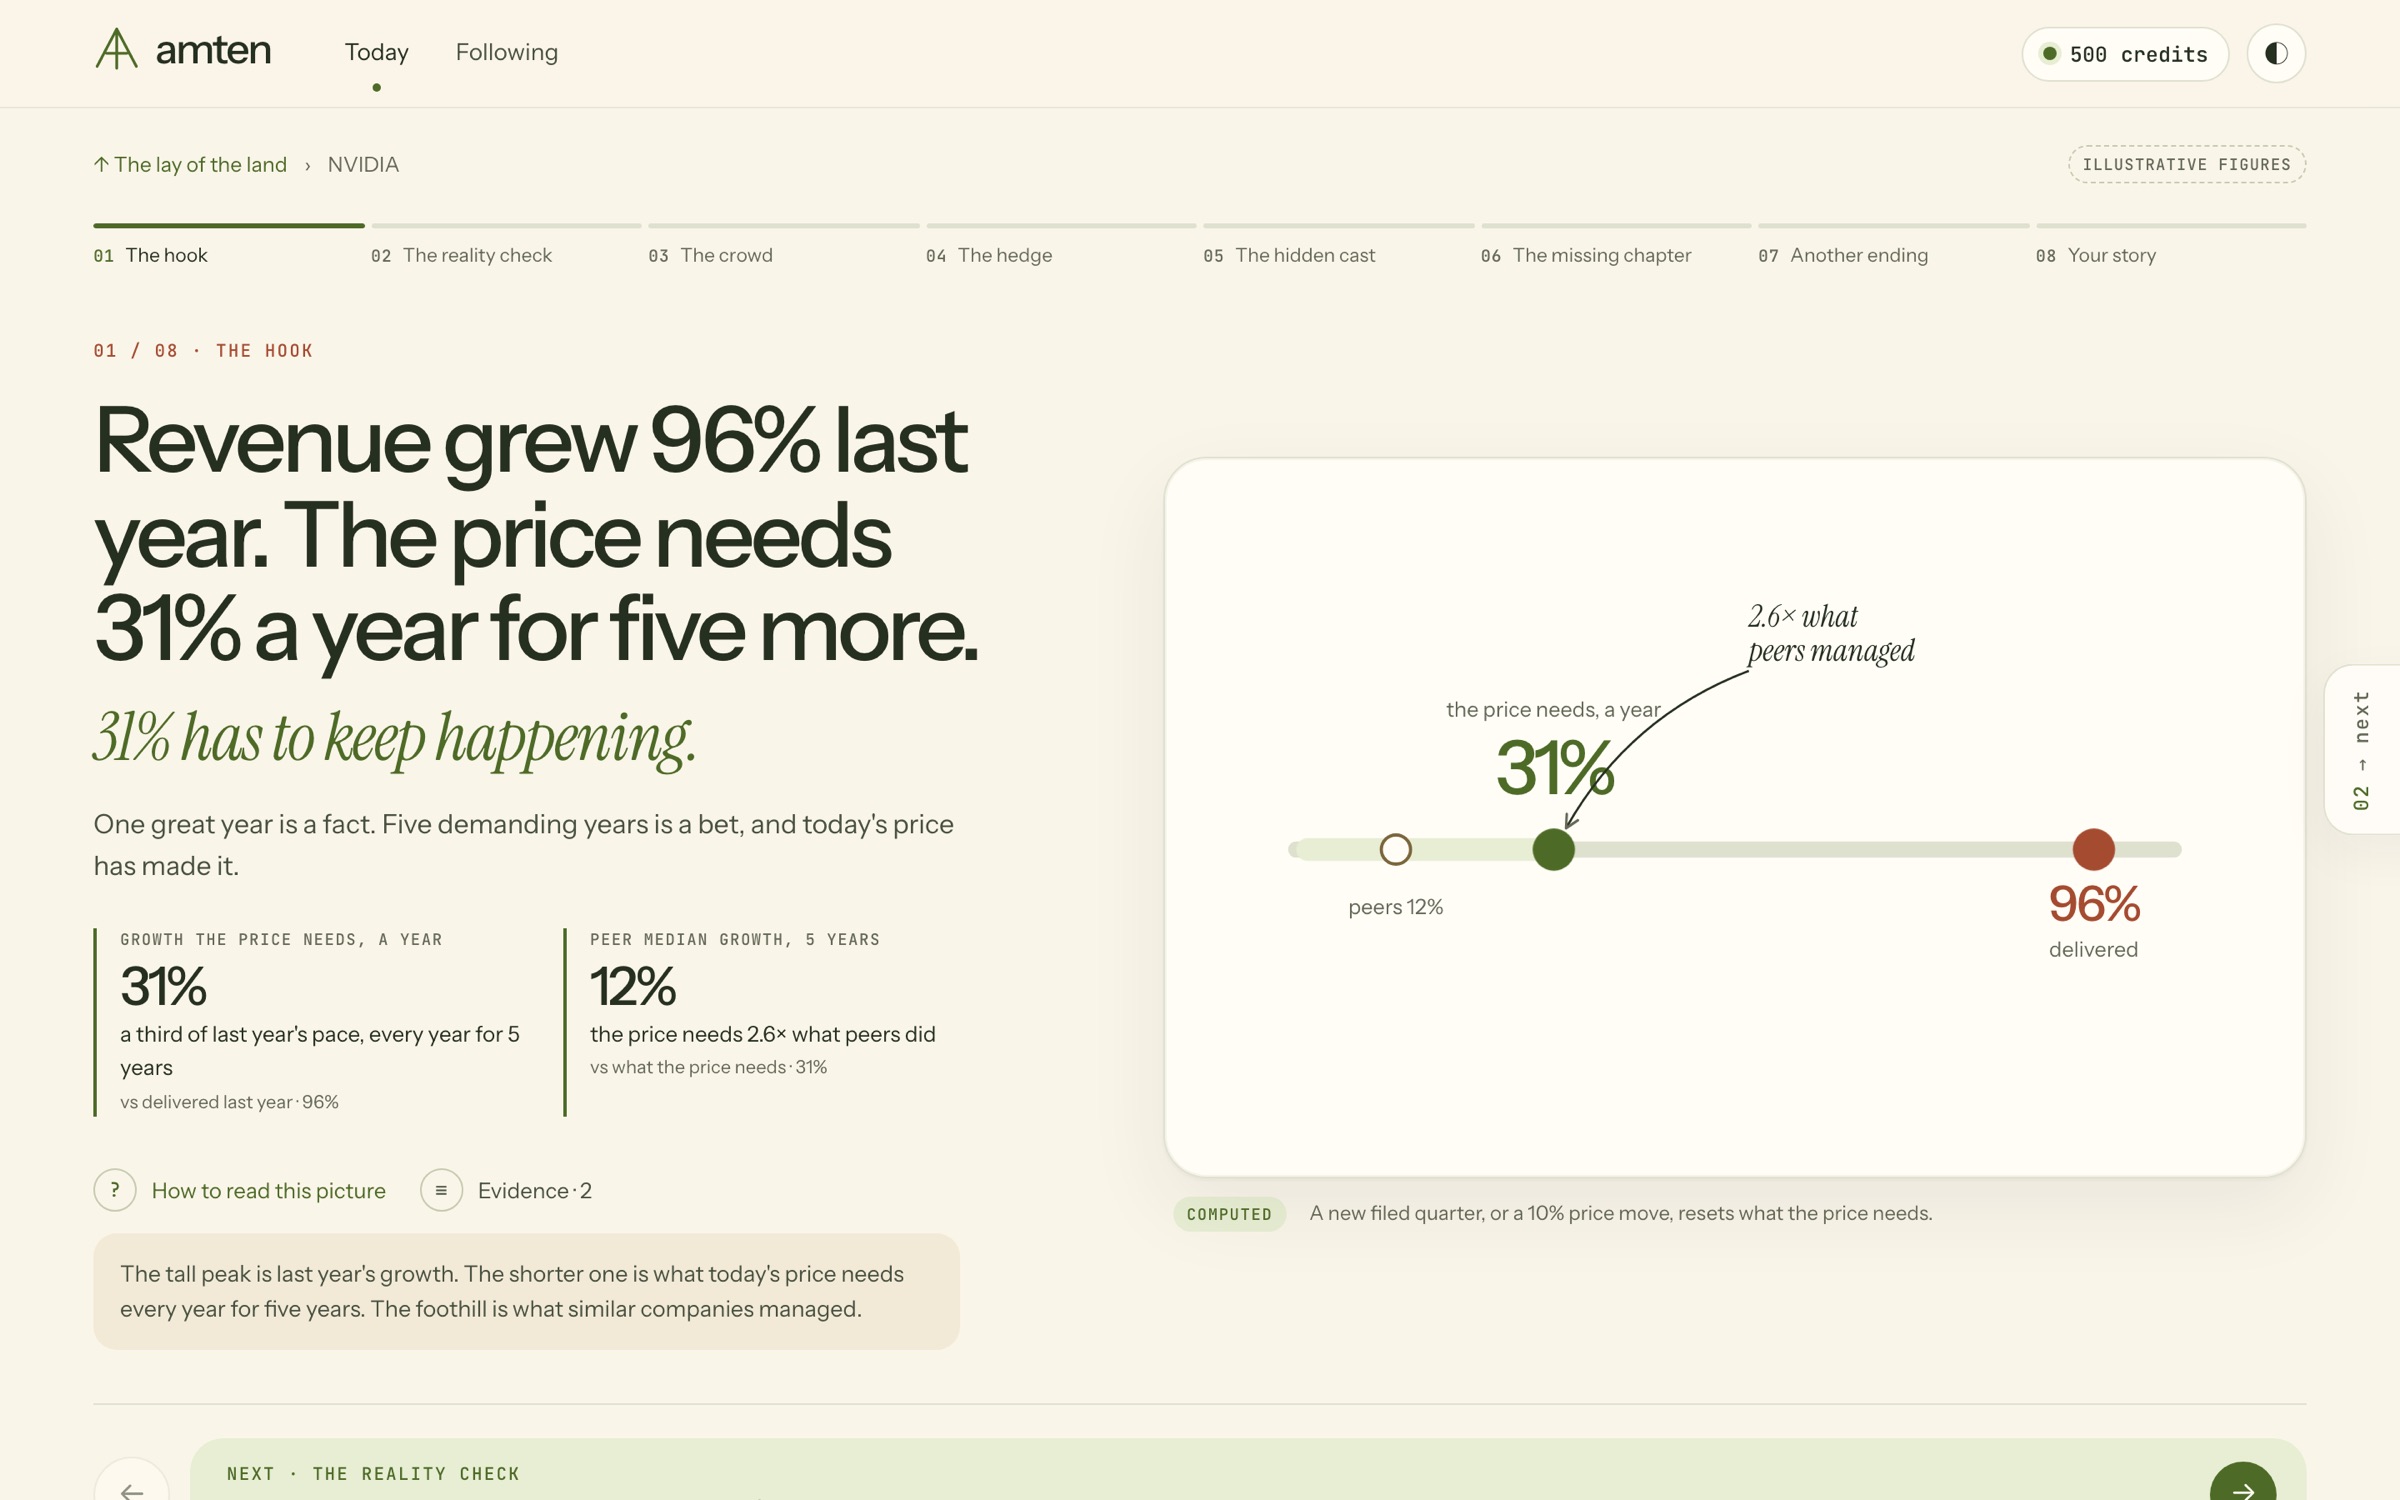
| Claim | One sentence, at most 90 characters | Revenue grew 96% last year. The price needs 31% a year for five more. |
| Kicker | The twist, in italic, at most 60 characters | 31% has to keep happening. |
| Numbers | At most three, each beside a comparator | 31% needed · 12% peer median · 96% delivered |
| Picture | One callout of six words or fewer | "2.6× what peers managed" |
| So what | Why it matters to this story, at most 140 characters | One great year is a fact. Five demanding years is a bet. |
The route and its chapter rhythm
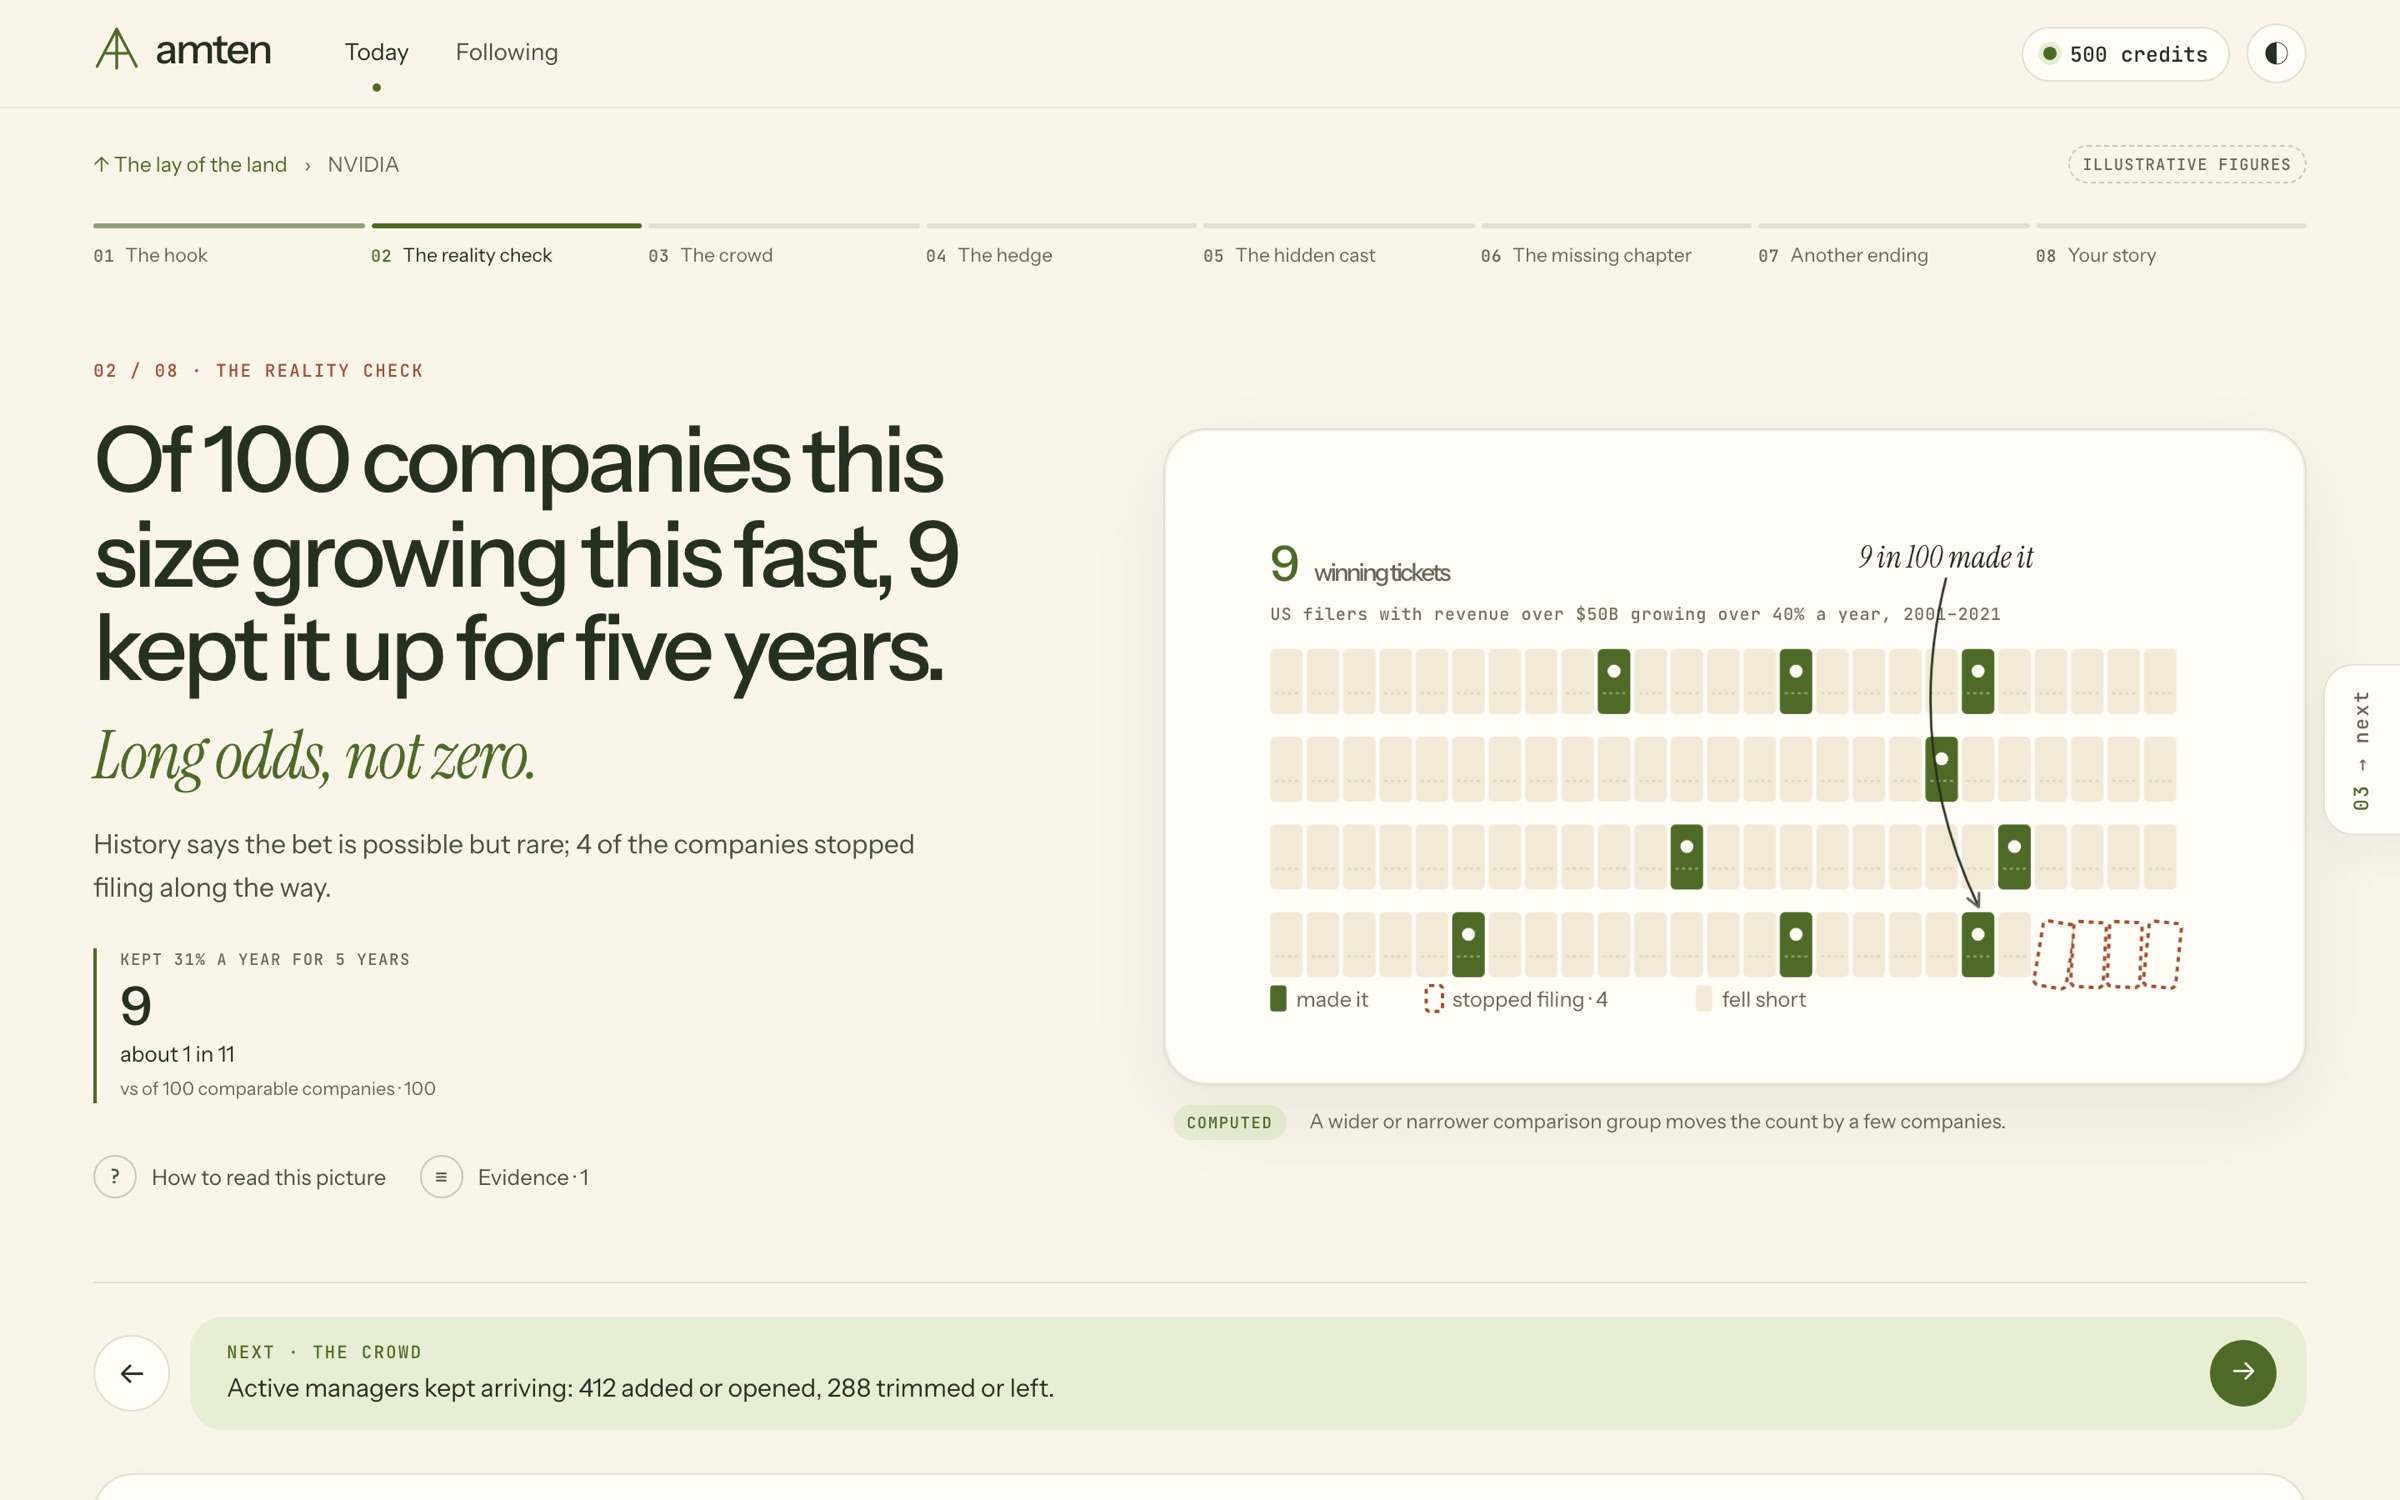
The suggested route has a rhythm: tension first, then the odds, then who is betting, then what nobody has priced, then a different ending, then the readings side by side. A company story usually takes all eight chapters; a branch can be as short as one beat. Beats off the route, such as "Inside the numbers", stay reachable from the map.
| Chapter | Its question | Illustrative NVIDIA beat |
|---|---|---|
| 01 The hook | What does the price need? | The price needs 31% a year for five years; peers did 12%. |
| 02 The reality check | How often does that happen? | Of 100 companies this size growing this fast, 9 kept it up for five years. |
| 03 The crowd | Who is moving the price? | 412 active managers added or opened; 288 trimmed or left. |
| 04 The hedge | What is protection costing? | Downside insurance costs 1.3 times upside, near its highest in a year. |
| 05 The hidden cast | Who else is in this story? | 4 customers bring 46% of revenue, and 3 of them design their own chips. |
| 06 The missing chapter | What hasn't the price caught? | Cloud giants' job postings for in-house chip designers are up 52% in a year. |
| 07 Another ending | What if something changes? | If cloud capital spending falls 20%, revenue falls about 14%. |
| 08 Your story | Which ending does the evidence lean to? | Three endings; 48% chance the path is met, against a 9% base rate. |
Moving around: keyboard and phone
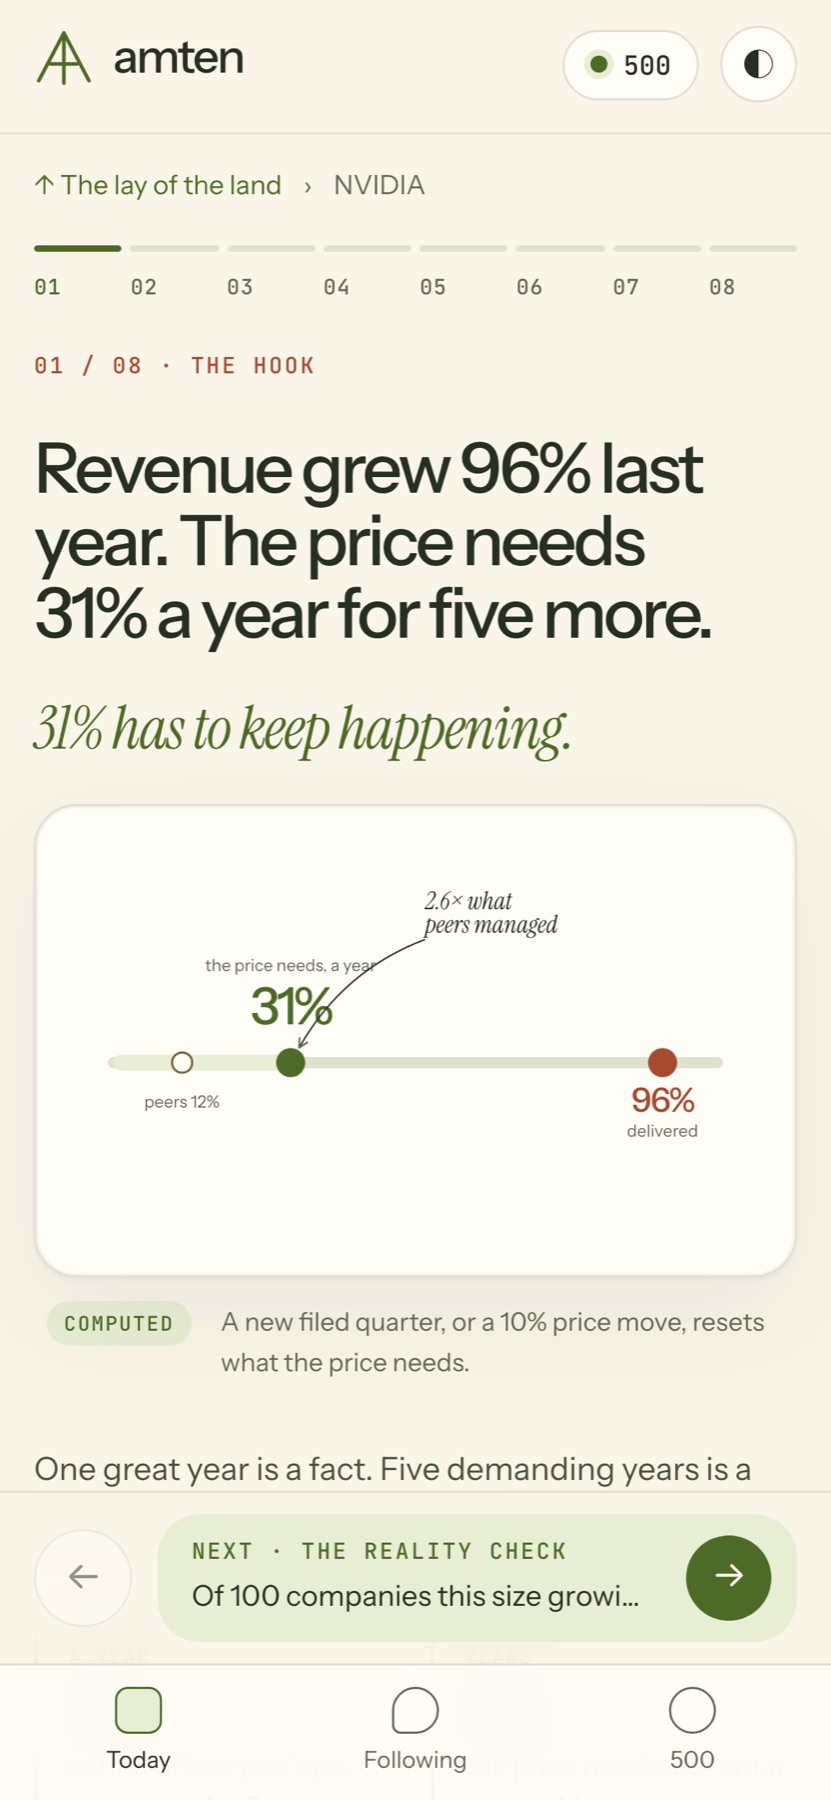
On a desktop the keyboard does everything. On a phone the route becomes full-screen cards that snap as you scroll, and the evidence becomes a sheet with a handle. With reduced motion switched on in your system settings, the 450 ms flight between map and beat becomes a cross-fade.
| To | Keyboard | Phone |
|---|---|---|
| Go to the next beat | → | Scroll up to the next card |
| Go back a beat | ← | Scroll down |
| Return to the lay of the land | ↑ | Tap "The lay of the land" or swipe in from the left edge |
| Close the evidence or step out | Esc | Pull the sheet down by its handle |
| See a beat's branches | Use the map's entrances | Swipe sideways on the beat |
"How to read this picture"
Every picture carries a one-line legend, filled with the beat's own figures. On the hook it reads, in effect: the tall peak is last year's growth, the shorter one is what today's price needs every year for five years, and the foothill is what similar companies managed. Pictures change from story to story, so the line is written for this picture, not for a chart type.
Colour has fixed meanings: ink is a fact, olive is what the price needs, coral is tension or a gap, wheat is context. Colour is never the only carrier; a label or a shape says the same thing.
The evidence sidebar, "Show the working" and how firm it is
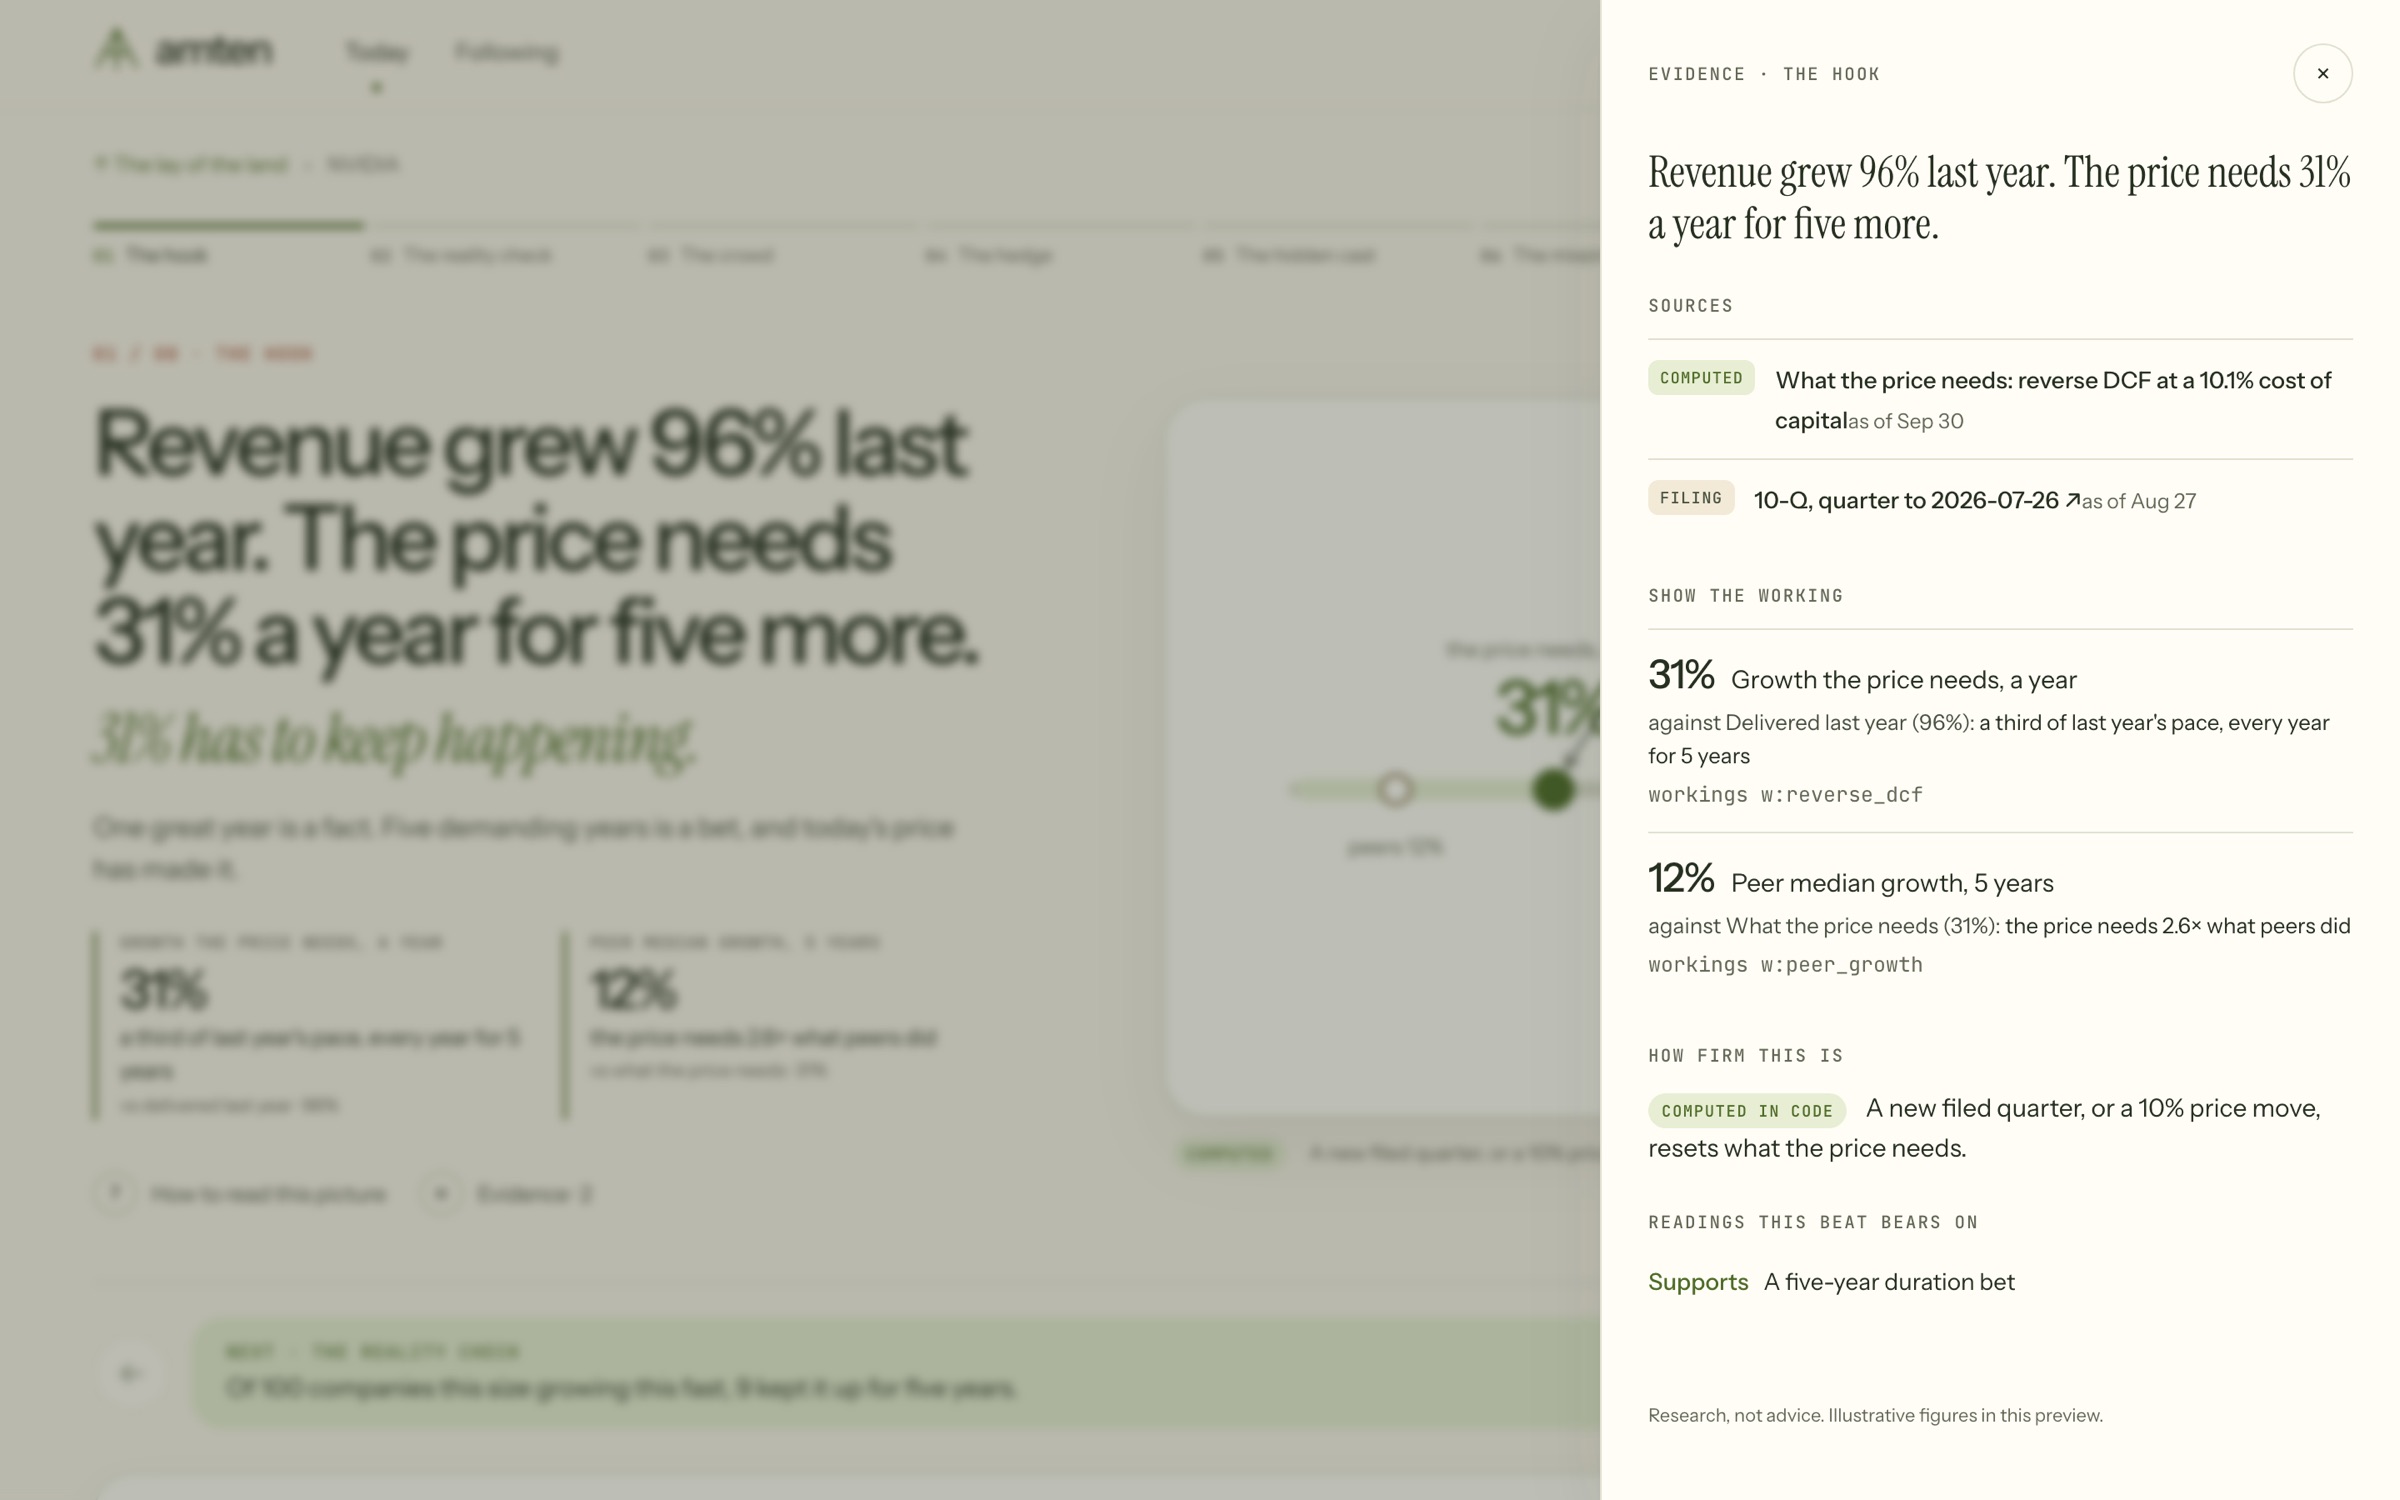
"Evidence" opens a sidebar on desktop and a bottom sheet on a phone. It never replaces the beat. It holds four things: the sources (a filed 10-Q with its date, or a computed figure), "Show the working" (the figure, its comparator and the computation behind it), how firm the beat is, and which competing readings the beat supports or argues against.
On the hook, the working for 31% says it is the growth the price needs each year at a 10.1% cost of capital, against 96% delivered last year. How firm it is comes as a band plus "what would change this": a new filed quarter, or a 10% price move, resets what the price needs.
Common questions
Do I have to follow the route?
No. The route is a suggestion. Any entrance on the lay of the land opens its beats directly, and the map stays one key (↑) away.
Why at most three numbers on a beat?
A beat is designed to be read in 5 to 10 seconds. More figures live in "Show the working", one tap away.
What does the callout on a picture do?
It marks the one mark that matters, in six words or fewer, such as "needs 3× what peers did", so the question "what am I looking at?" is answered on the picture itself.
Is the story the same for everyone?
Yes, per version. The pictures are chosen on the server, so a given version looks the same on every screen and in shared links.