Make sense answers "Why is it priced like this?" Amten reverse-engineers the growth the price needs, checks it against how often companies have delivered it, reads the business per $100 of sales, and asks who is moving the price: active owners from 13F filings, the options market's implied move and the cost of downside protection. It places all of that in the macro regime, the sector rotation and, for funds, what the holdings add up to, then sets at least two competing readings side by side.
What the price needs
A price is an answer to a question nobody wrote down: what future would make this value reasonable? Amten runs a reverse discounted cash flow. It holds the price fixed, sets the cost of capital (10.1% in the illustrative NVIDIA case), and solves for the revenue growth that makes the two meet.
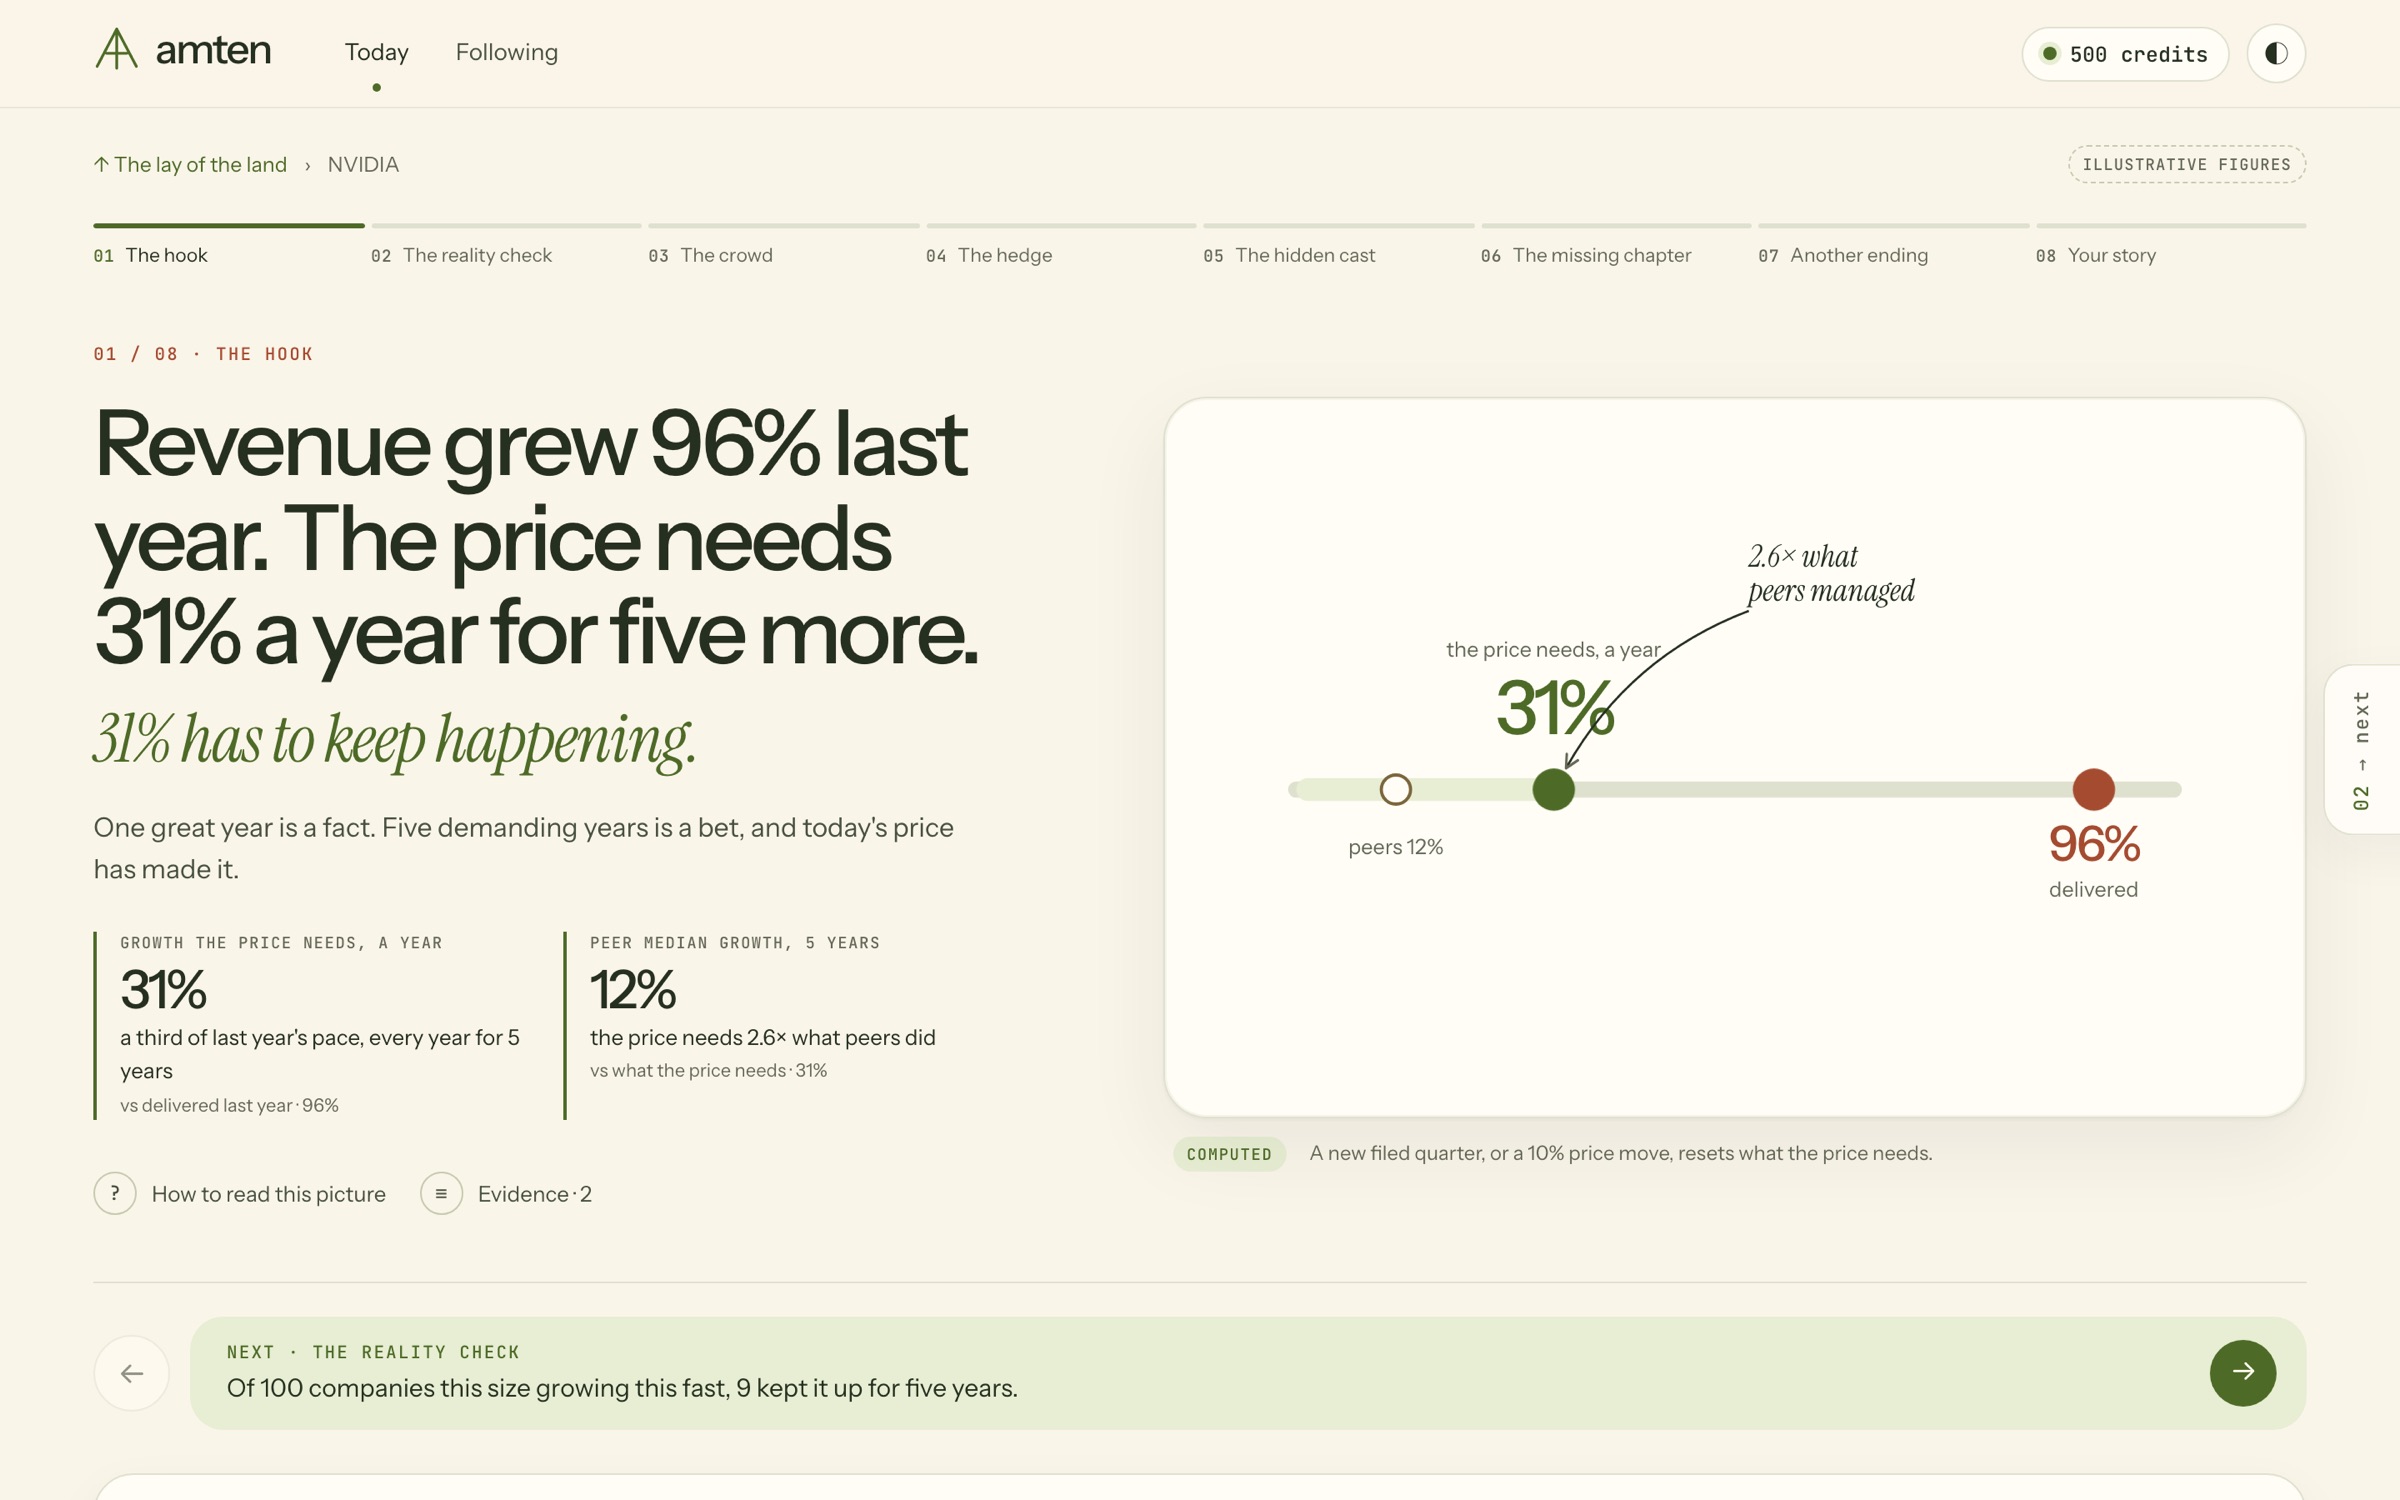
Then it puts that number beside two comparators. In the illustrative case the price needs 31% a year for five years, against 96% delivered last year and a 12% five-year median for peers. 31% is a third of last year's pace, and 2.6 times what peers managed. That is the hook: one great year is a fact, five demanding years is a bet.
The reality check: base rates
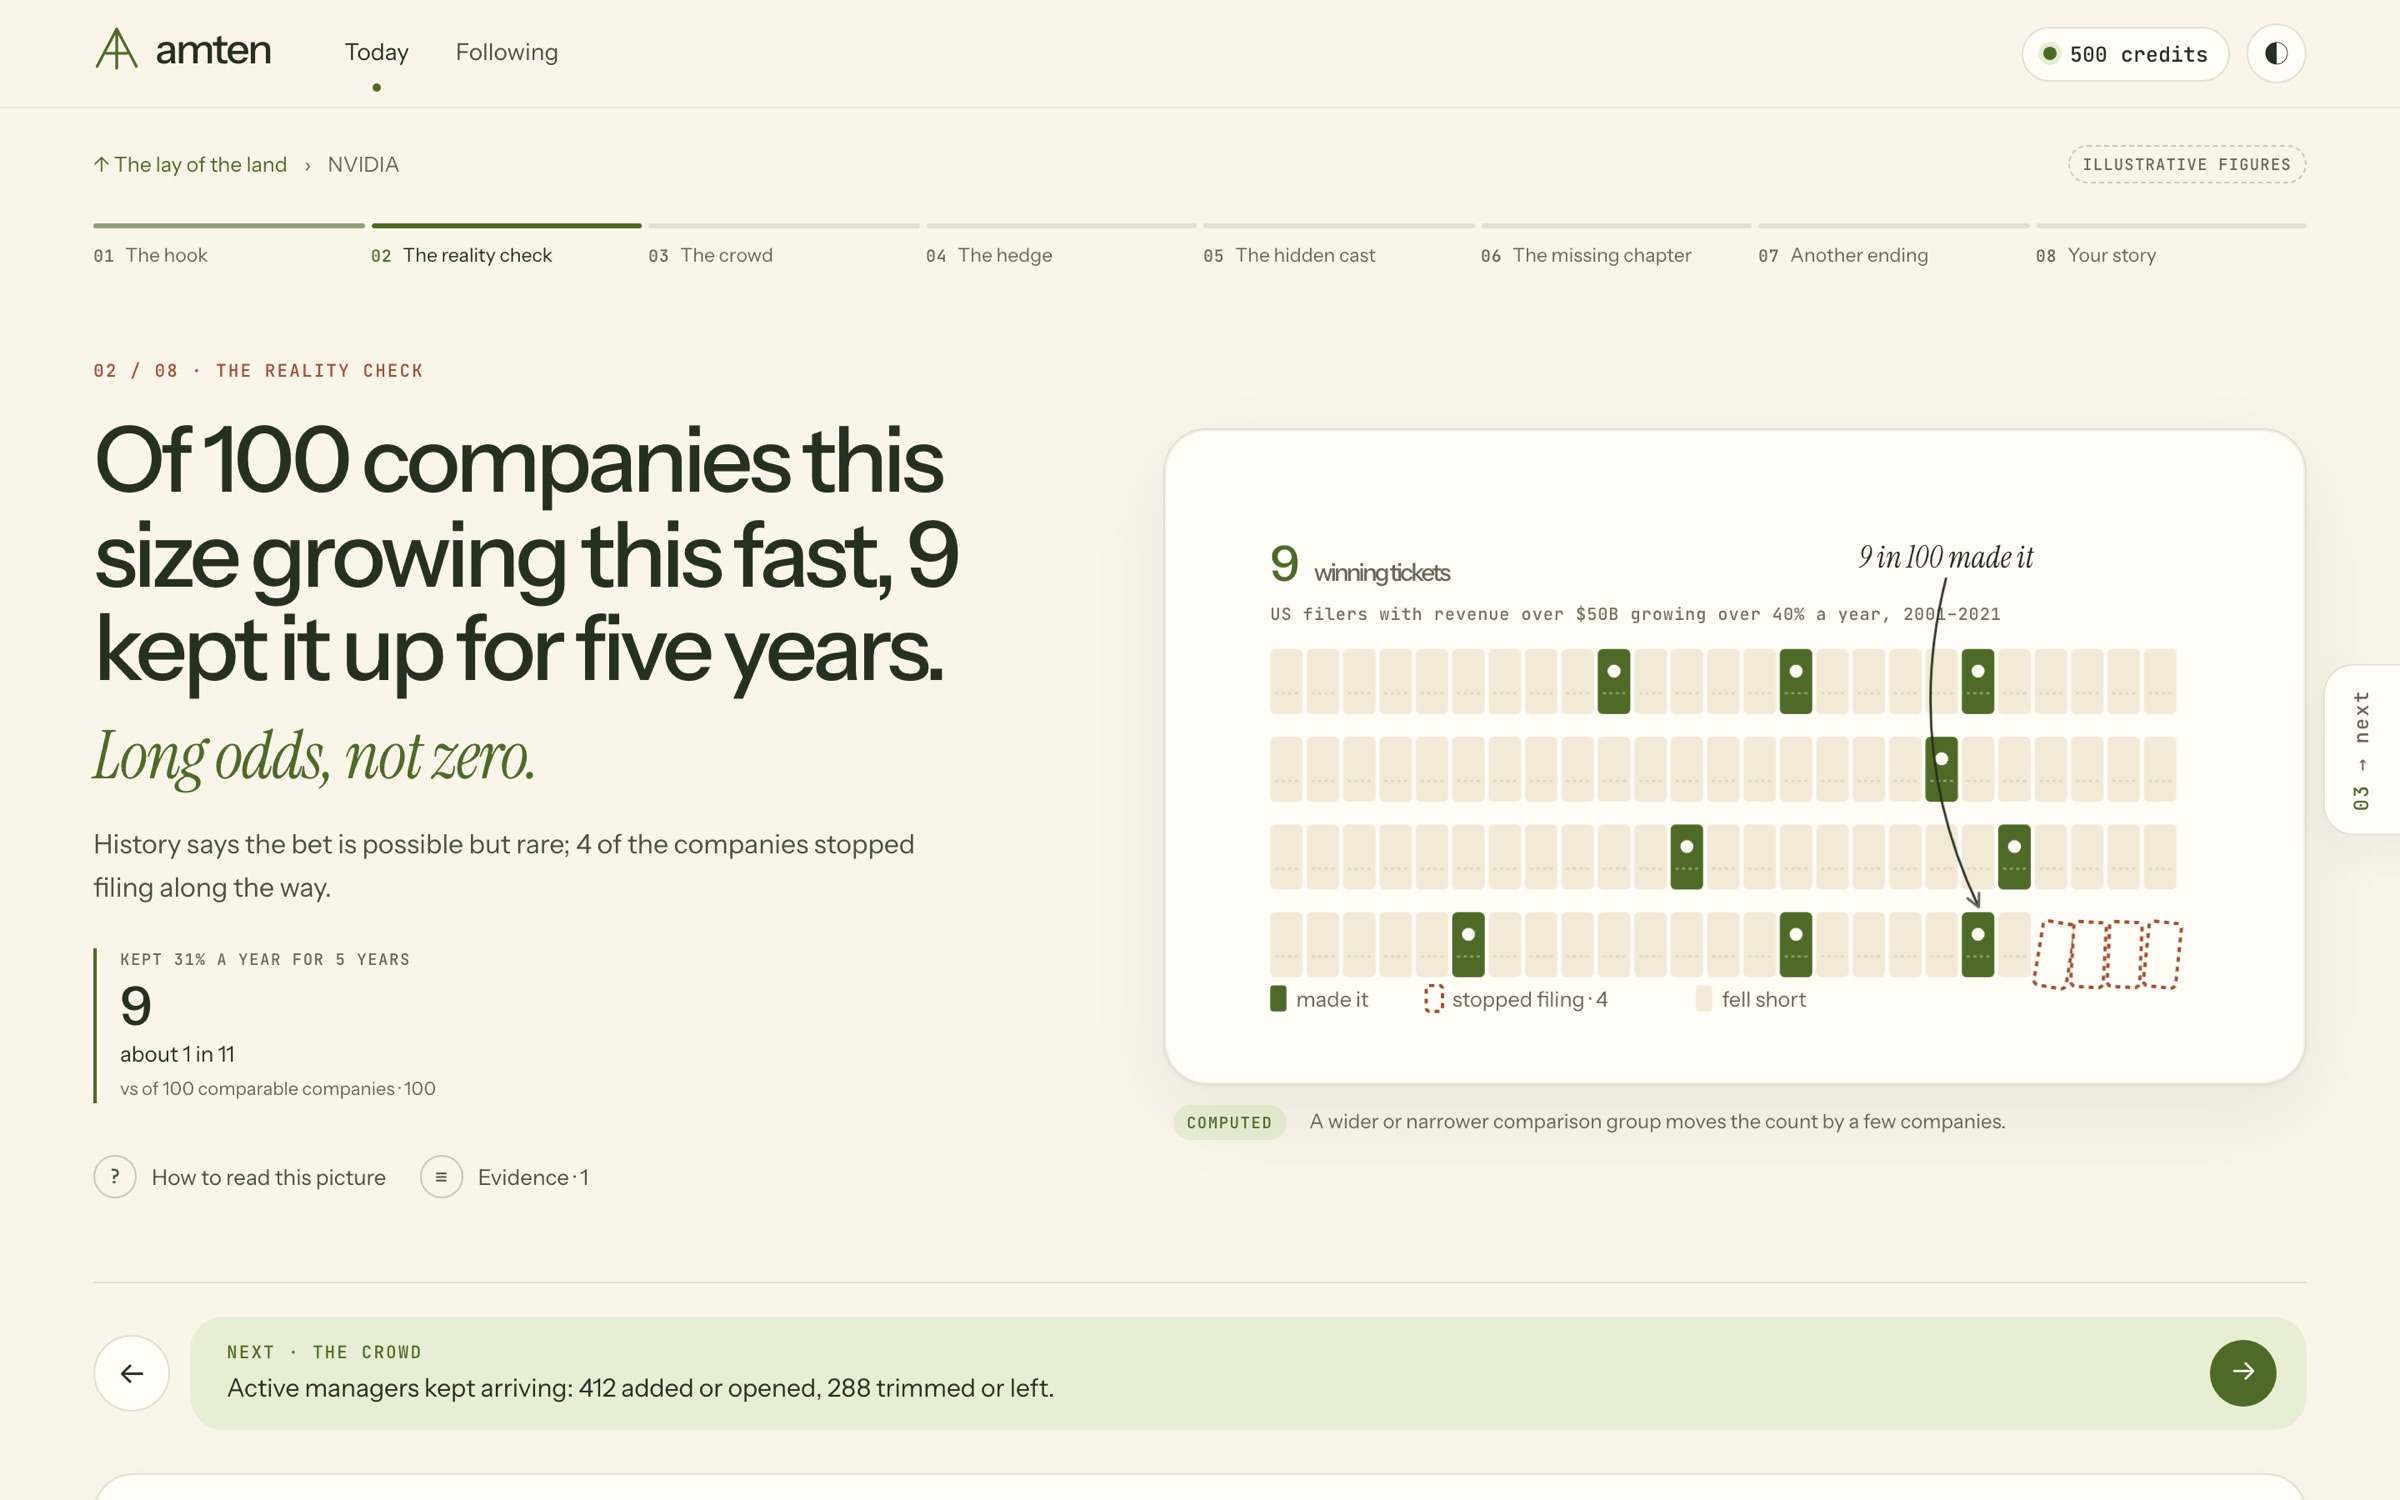
A requirement means little without its odds. Amten takes a reference class of companies of similar size growing at a similar pace and counts how many kept the required rate for the full period. In the illustrative case, 9 of 100 kept 31% a year for five years, and 4 stopped filing along the way. The kicker says it plainly: long odds, not zero.
The reference class is stated in the working, and a wider or narrower group moves the count by a few companies. The base rate is the outside view; the rest of the story asks whether this company is one of the 9.
Inside the numbers: of every $100
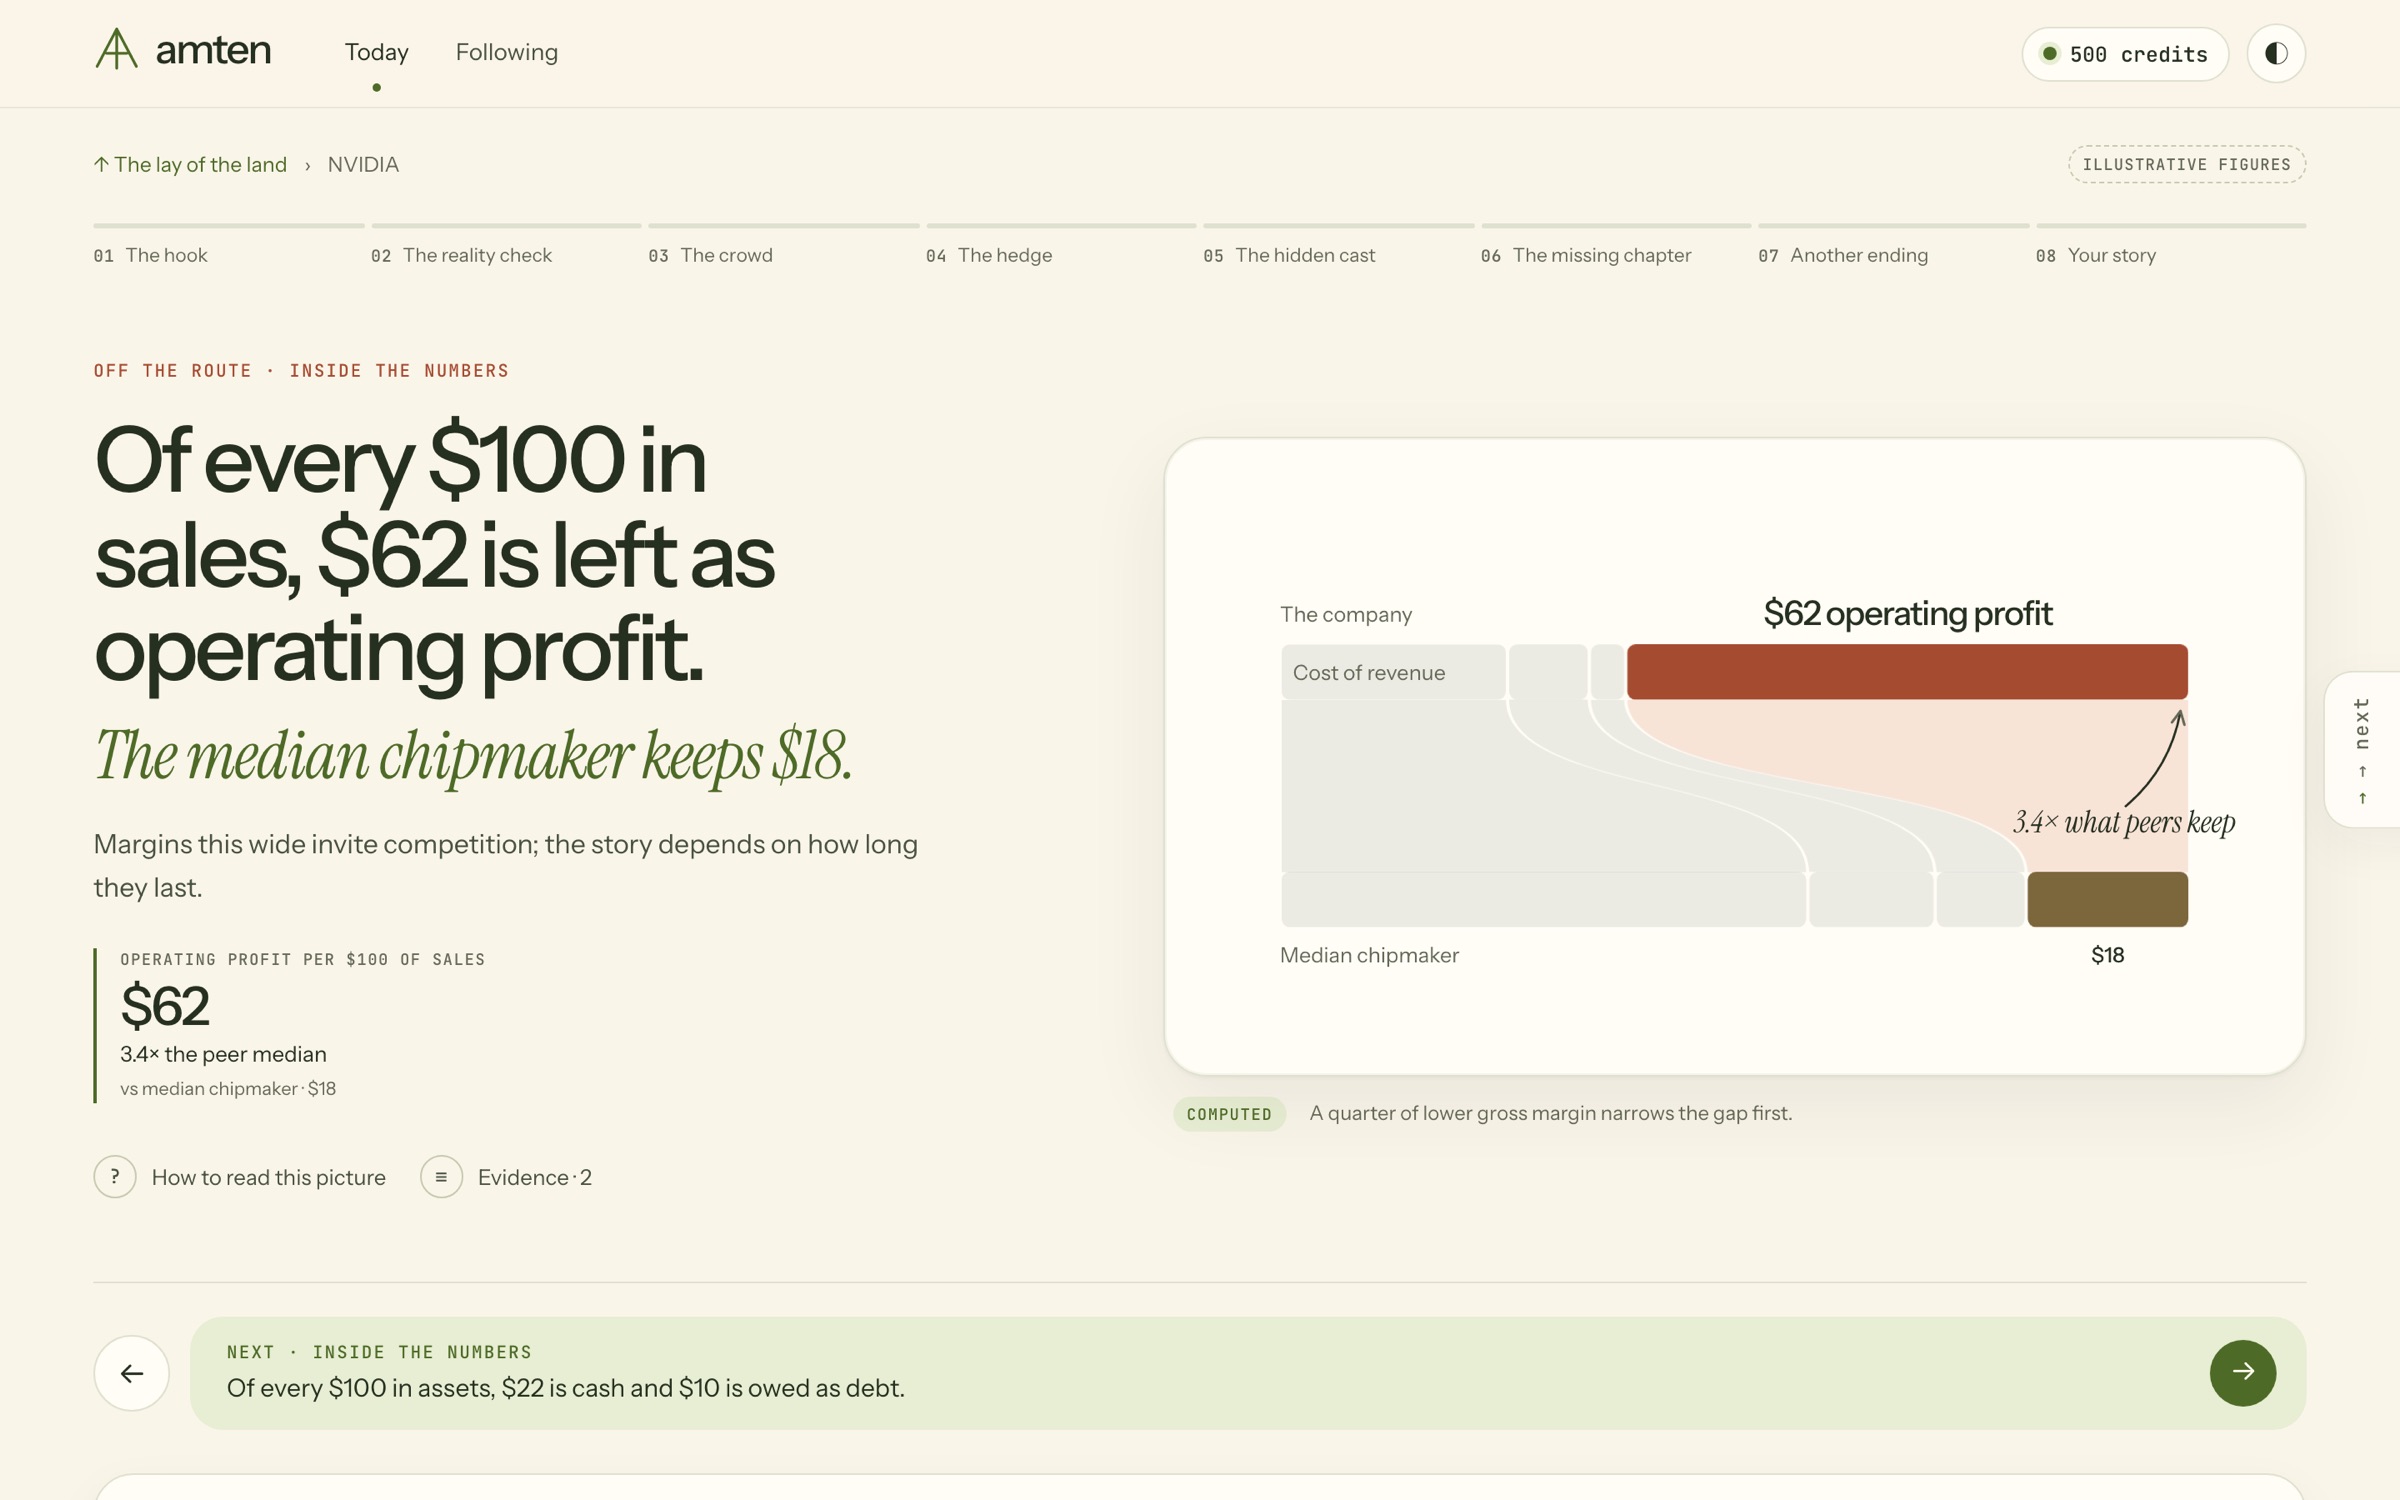
Financial statements are translated into one unit: $100 of sales. In the illustrative NVIDIA case, $62 of every $100 in sales is left as operating profit, against $18 for the median chipmaker, 3.4 times as much. Margins that wide invite competition, so the story depends on how long they last.
The balance sheet gets the same treatment: of every $100 in assets, $22 is cash and $10 is owed as debt. These beats sit just off the route; open them from the map when the hook makes you ask how the money is made.
The crowd: owners and options
Prices are moved by people with money at risk. Amten reads three groups separately, then together. Owners come from 13F filings, which arrive up to 45 days after quarter-end: in the illustrative case 412 active managers added or opened a position and 288 trimmed or left, about 1.4 arriving for each one leaving, with concentrated managers arriving nearly 3 to 1.
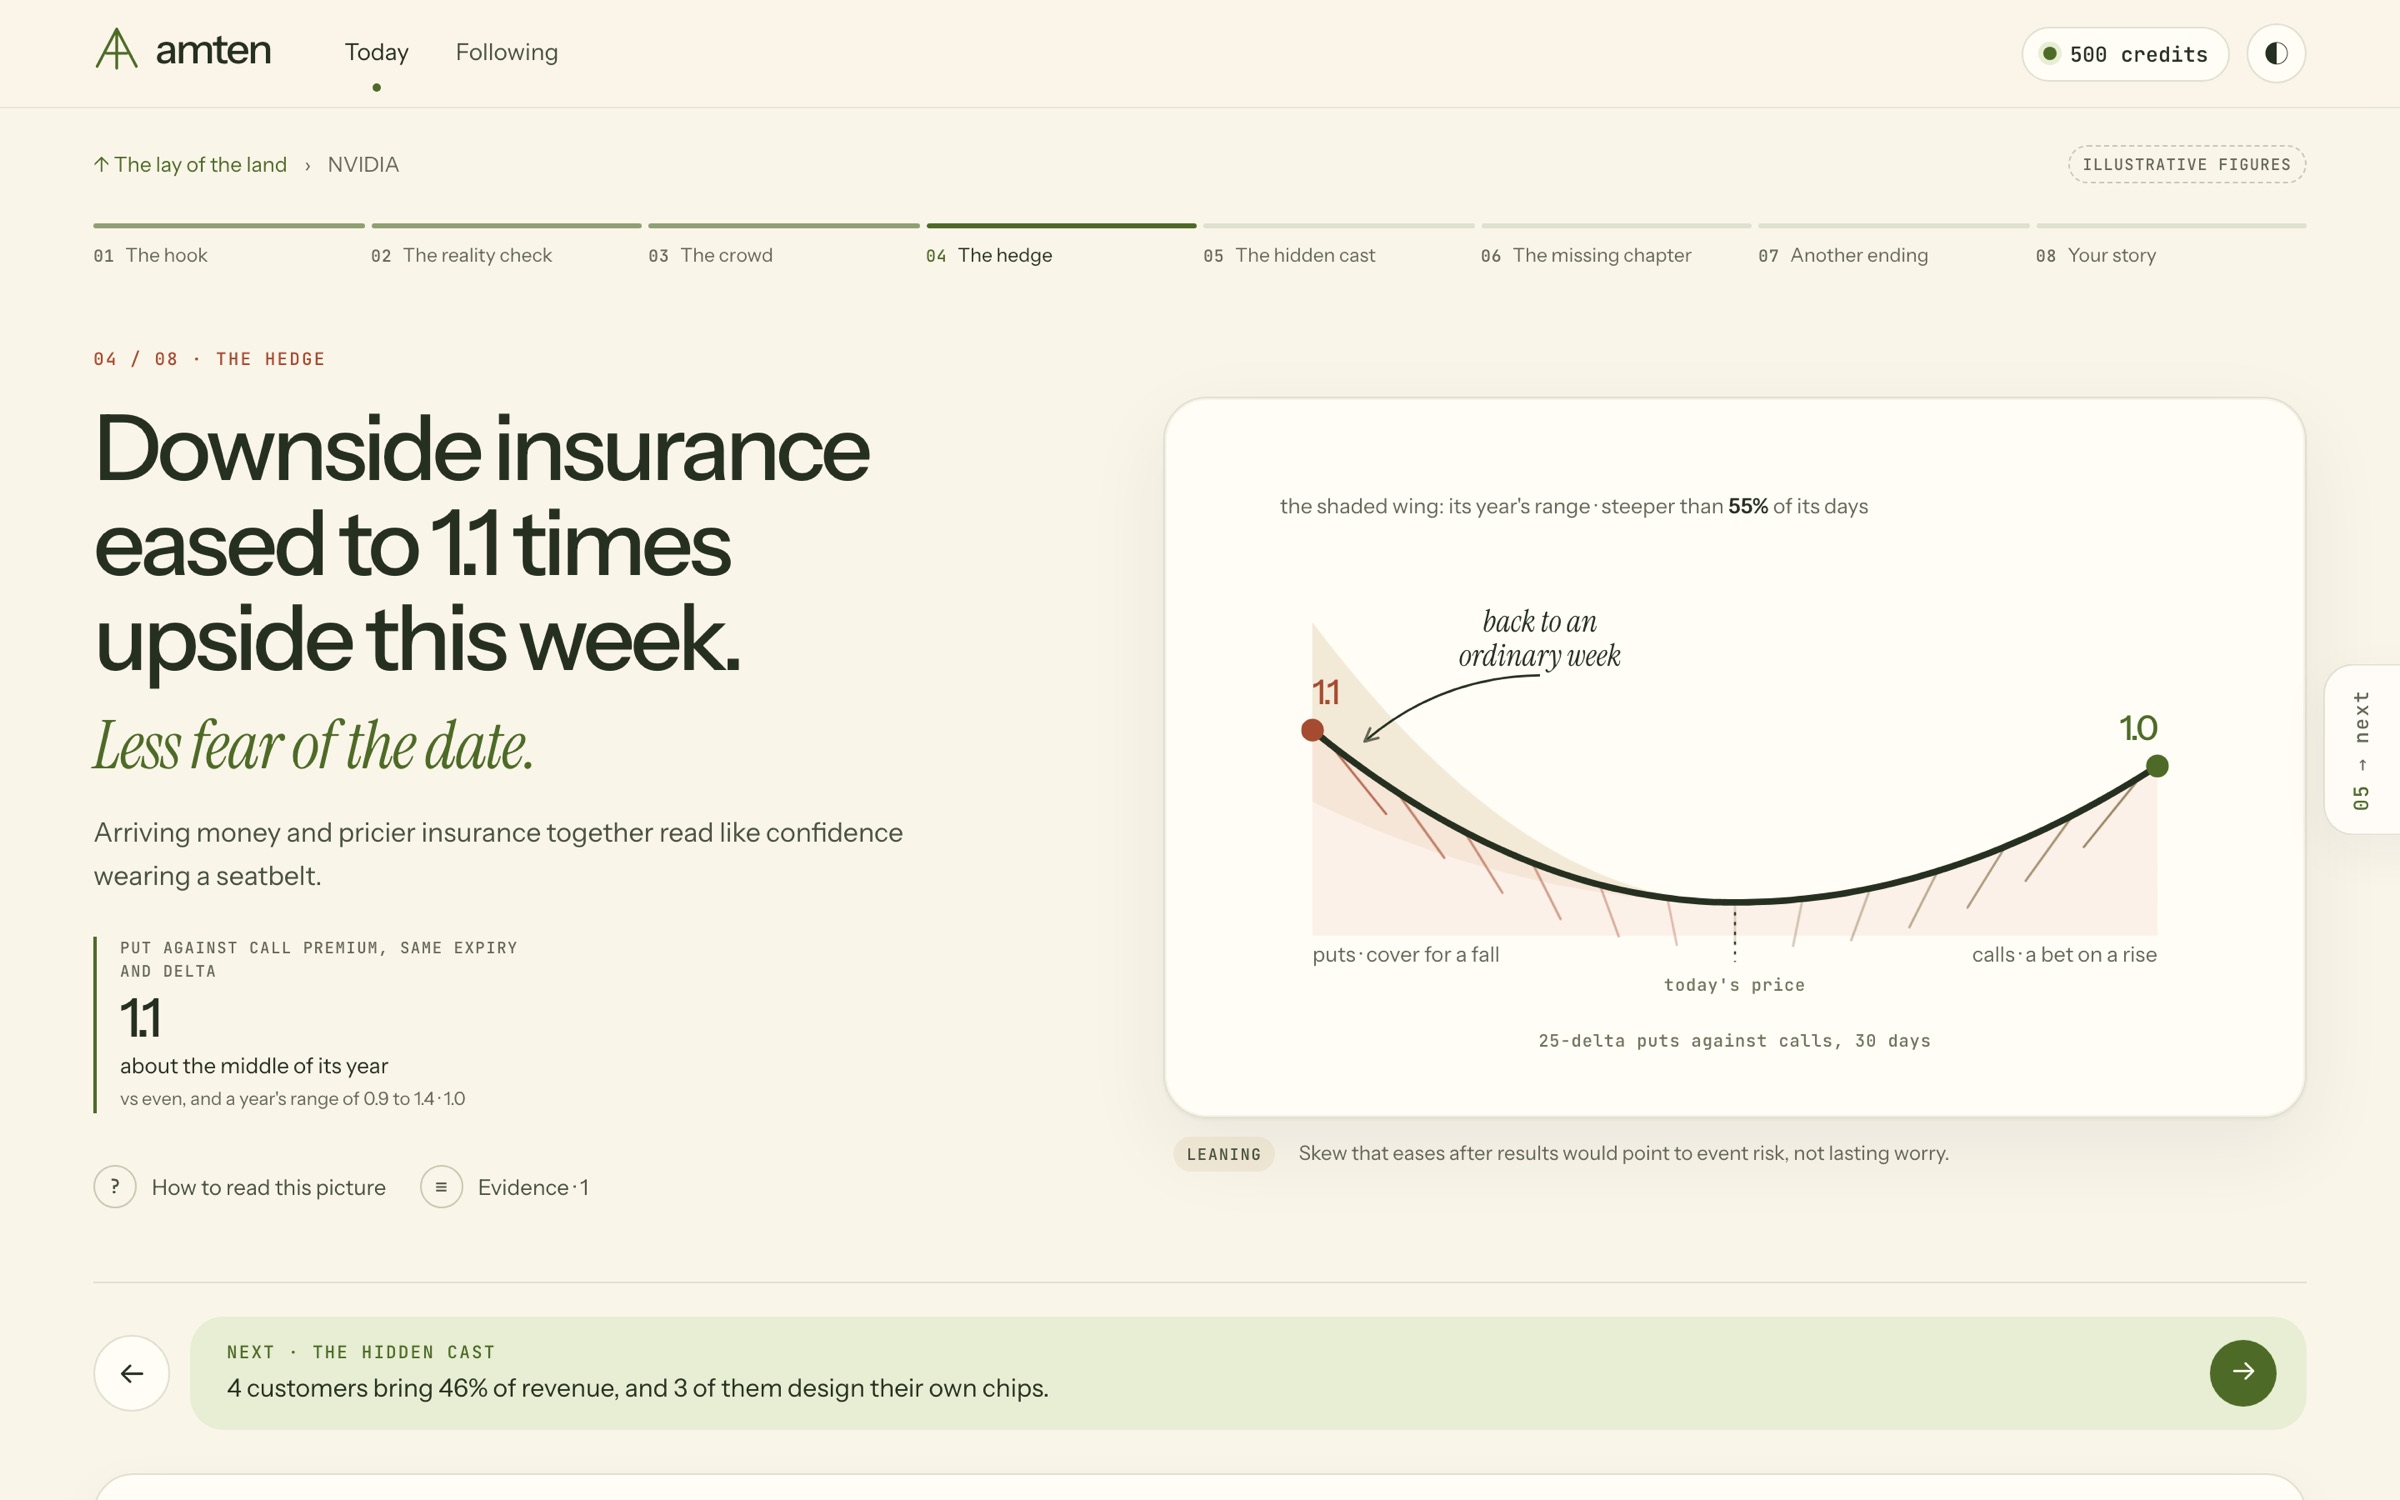
Options price the next move and its asymmetry. The implied move for results day is 8%, against a 6% average actual move on past results days. Skew is the price of downside insurance against upside: 1.3 times in version 1, near its highest in a year, easing to 1.1 times in version 2. Money arriving while protection gets pricier reads like confidence wearing a seatbelt.
The backdrop: macro regime, sector rotation and funds
Some stories are about the whole market. A Market story places the US economy on a growth-and-inflation map with a trail, reads rates, the dollar, credit and oil each against its own year, and asks what the market is bracing for. Sector prices and inflation breakevens move before the growth and inflation data do, so they lead the story.
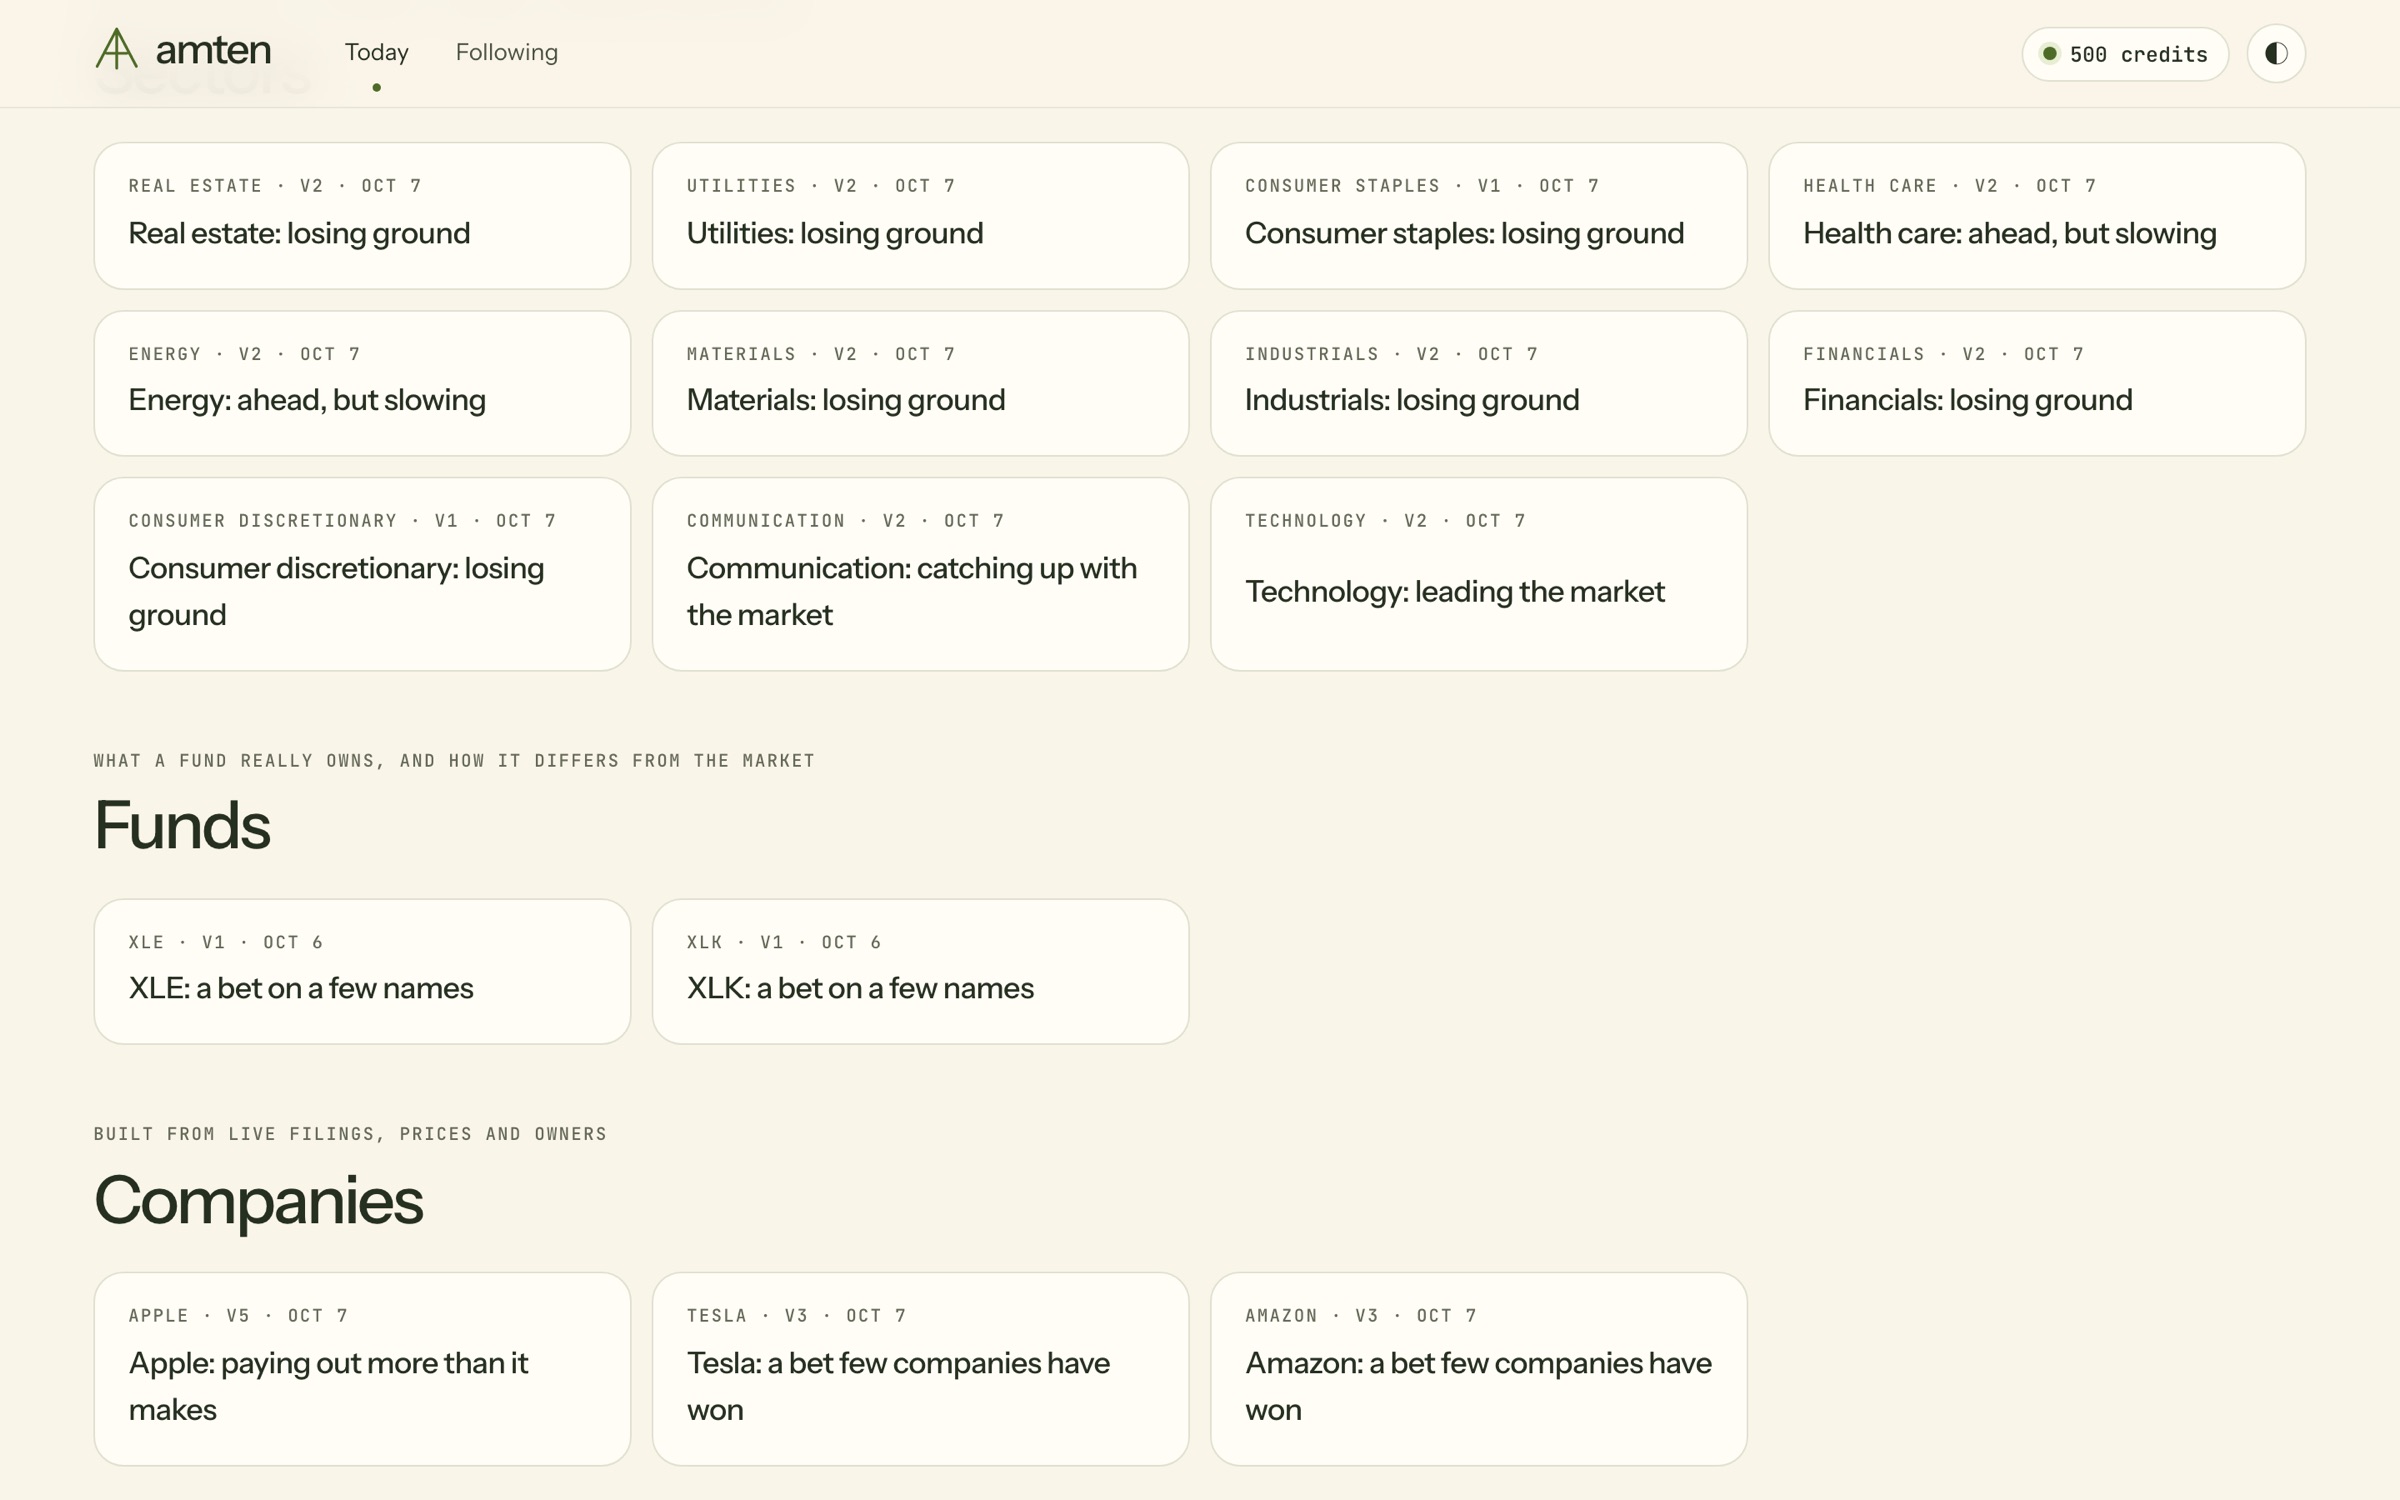
A Sector rotation story tracks each sector's relative strength and momentum against the market, with a five-step trail through four quadrants: leading, weakening, lagging, improving. A Fund story opens an ETF such as XLE and asks what its holdings add up to: the shared exposures, the tilt, what changed in the holdings, and what the fund needs to be true.
Competing readings, side by side
Every story with an interpretation carries at least two. Each reading names its mechanism, the beats that support it and the beats that argue against it, and what would confirm or refute it. Plausibility is judged per reading and is not forced to sum to 1, because two readings can both be partly true.
| Reading (illustrative) | Plausibility | What would confirm it | What would refute it |
|---|---|---|---|
| A five-year duration bet | .58 | Growth holds above 31% through the next four quarters | Guidance cut below the required path |
| Confidence wearing a seatbelt | .40 | Arrivals keep outnumbering departures while skew stays high | Skew falls back to the middle of its year |
| Customers becoming competitors | .31 in v1, .49 in v2 | A large customer reports its own chips carrying real workloads | In-house chip programmes stall or shrink |
Common questions
Is "what the price needs" a forecast?
No. It is the growth that makes a valuation model match today's price, given a stated cost of capital and horizon. It describes the bet, not the outcome.
Why compare with peers and base rates at all?
A number alone has no scale. 31% a year means one thing beside a 12% peer median and a 9-in-100 base rate, and something else beside a 30% peer median.
Are 13F holdings current?
No. They are quarter-end snapshots filed up to 45 days later, covering long positions in listed US securities. Amten dates them on the beat.
Why show more than one reading?
A price is compatible with several stories. Showing at least two, each with what would confirm and refute it, keeps the reading testable and keeps Amten from issuing a verdict.